|
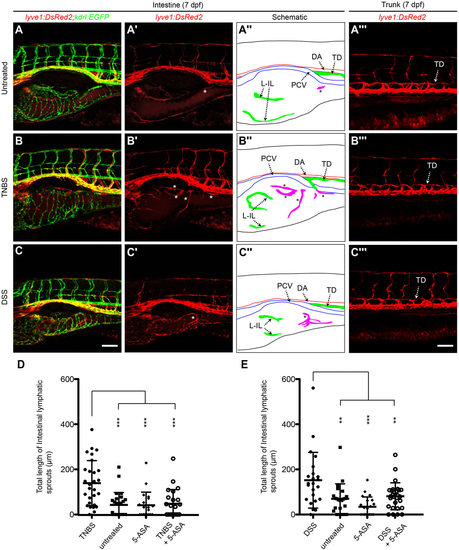
Colitogenic challenge is associated with increased intestinal lymphangiogenesis. (A-C) Lateral images of lyve1:DsRed2;kdrl:EGFP larvae at 7dpf (A), treated with TNBS (B) or DSS (C). Asterisks indicate intestinal lymphatic sprouts (ILSs). A′-C′ shows the left intestinal vasculature and A′′′-C′′′ shows the trunk vasculature in the DsRed channel only. A′′-C′′ are schematic diagrams of arteries (red), veins (blue), lymphatic vessels (green) and ILS (magenta) of A-C. (D-G) Quantification of ILS number (D,E) and total ILS length (F,G) in TNBS (D,F) and DSS (E,G) treated larvae compared with untreated, 5-aminosalicylic acid (5-ASA), and TNBS/DSS+5-ASA (ne20). Error bars, ±s.d. *P<0.05, **P<0.01, ***P<0.001 by one-way ANOVA with Dunnett′s multiple comparison test. DA, dorsal aorta; L-IL, left intestinal lymphatics; PCV, posterior cardinal vein; TD, thoracic duct. Scale bar: 100µm.
|