
FIGURE
Fig. 5
- ID
- ZDB-FIG-151112-10
- Publication
- Chen et al., 2012 - Characterization of two novel small molecules targeting melanocyte development in zebrafish embryogenesis
- Other Figures
- All Figure Page
- Back to All Figure Page
Fig. 5
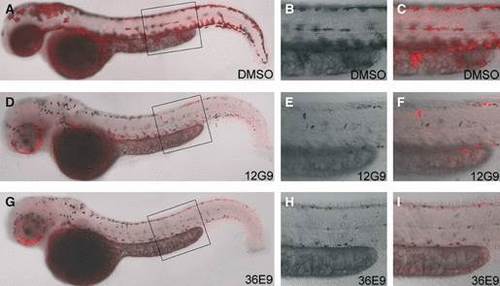
12G9 and 36E9 treatment leads to loss of dct expression in melanocytes. All embryos were treated from 30 to 48 hpf. Lateral view, anterior to the left and dorsal to the top. Dct expression is in red. The right two columns are higher magnifications of boxed areas in the most left column. (A to C) In DMSO treated embryos, melanin (black) and dct expression (red) overlapped perfectly. (D to I) In 12G9 or 36E9 treated embryos, only a few melanocytes had overlapping melanin and dct expression. |
Expression Data
Expression Detail
Antibody Labeling
Phenotype Data
Phenotype Detail
Acknowledgments
This image is the copyrighted work of the attributed author or publisher, and
ZFIN has permission only to display this image to its users.
Additional permissions should be obtained from the applicable author or publisher of the image.
Full text @ Pigment Cell Melanoma Res.