
Fig. 5
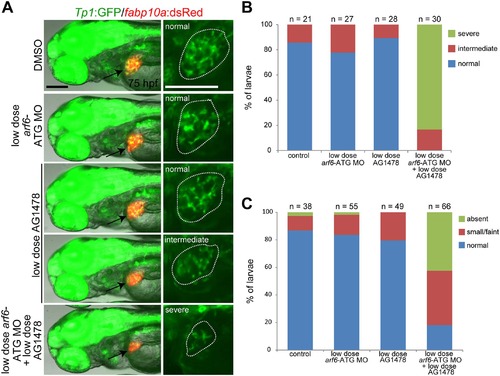
EGFR signaling and Arf6 act in the same pathway in the regulation of intrahepatic biliary morphogenesis. Instead of 4 µM AG1478 and 2 ng of arf6-ATG MO, 1 µM AG1478 and 0.5 ng of arf6-ATG MO were used. (A) Epifluorescence images showing the expression of Tp1:GFP and fabp10a:dsRed revealed a severe defect in the intrahepatic biliary structure only when the MO injection was combined with the AG1478 treatment. Based on the severity of the biliary defect, larvae were divided into three groups: normal, intermediate, and severe. Arrows point to the liver and dotted lines outline the liver. Scale bars, 100 µm. (B) Graph showing the percentage of larvae in each group shown in A. (C) Graph showing the percentage of larvae exhibiting different levels of PED-6 accumulation in the gallbladder at 5 dpf. n indicates the number of larvae examined. |
| Fish: | |
|---|---|
| Condition: | |
| Knockdown Reagent: | |
| Observed In: | |
| Stage: | Day 5 |