
Fig. 4
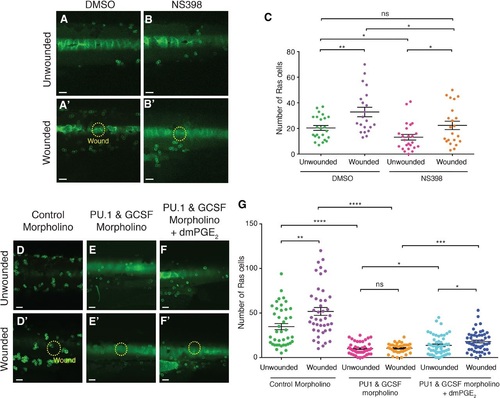
PGE2 is one component of the trophic signal driving woundinflammationtriggered preneoplastic cell proliferation A–B′ Images of Ras+ larval flanks from control fish bathed in Danieau′s solution or with 10 µM NS398 to block Cox2 enzyme activity, and left unwounded (A, B) or laserwounded (A′, B′) at 3 dpf before subsequent fixation at 5 dpf. C. Graph showing quantification of preneoplastic cell numbers at 5 dpf from (A–B′) (n = 15–20 larvae in each group). D, D′ Unwounded control Ras+ larvae (D) versus sibling larvae that have been laserwounded at 2 dpf (D′). E–F′ Unwounded versus wounded larvae after injection with PU1 and GCSF morpholinos (E and E′), and addition of 20 µM dmPGE2 (F and F′). G. Graph showing preneoplastic cell numbers from (D–F′). |
| Gene: | |
|---|---|
| Fish: | |
| Conditions: | |
| Knockdown Reagents: | |
| Anatomical Term: | |
| Stage Range: | Long-pec to Day 5 |