
Fig. 2
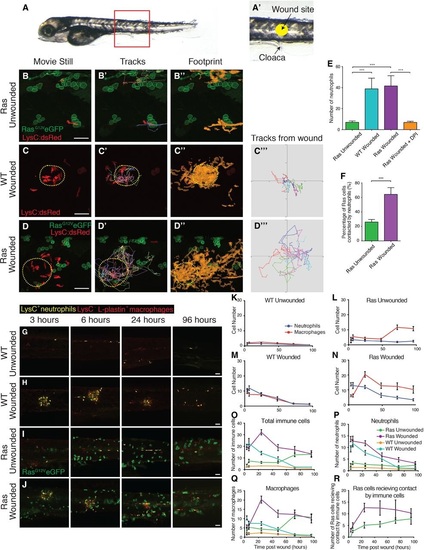
Live imaging reveals neutrophils distracted away from wounds due to competing signals from adjacent pre-neoplastic cells. A, A′ Fivedays postfertilisation larva illustrating the region of flank where we image and wound (A). Wounds (yellow circle) are made in the centre of the flank just above the cloaca (arrow) in all larval experiments (A′). B–B′′ Stills from a timelapse movie of a larva with RasG12VeGFP preneoplastic cell clones but no wound. C–C′′′ Equivalent timelapse stills of a control, laserwounded larva with no preneoplastic cell clones at 90 min postwounding (wound indicated with yellow dotted line). D–D′′′ Stills from a timelapse movie of a larva with RasG12VeGFP preneoplastic cell clones (green), again wounded 90 min before. E. Graph comparing the number of LysC:dsRed+ neutrophils recruited over a 2h period to the equivalent flank region of unwounded RasG12VeGFP larvae (n = 11), versus wounded WT larvae (n = 3), wounded RasG12VeGFP larvae (n = 5) and wounded RasG12VeGFP larvae treated with DPI inhibitor (n = 7). ***P d 0.001. F. Graph comparing the percentage of Ras+ preneoplastic cells that receive contacts with neutrophils during the 2h period of the movie in unwounded (n = 11) versus wounded (n = 5) larvae. ***P d 0.001. G–J Unwounded WT sibling; LysC:dsRed+ larva (n = 10 per time point) for comparison of clone growth with (H) laserwounded WT sibling: LysC:dsRed+ larva (n = 15 per time point), (I) unwounded Ras+; LysC:dsRed+ larvae (n = 15 per time point) and (J) laserwounded Ras+; LysC:dsRed+ (n = 20 per time point). Larvae were harvested and fixed between 3 dpf and 7 dpf (i.e. between 3 and 96 h postwounding), and stained with antiLplastin and antiRFP antibodies to distinguish neutrophils (yellow) and macrophages (red). K–N Graphs showing the numbers of neutrophils and macrophages in the flanks of unwounded WT siblings (K), unwounded Ras+ larvae (L), wounded WT siblings (M) and wounded Ras+ larvae (N). O–Q Graphs indicating the total number of innate immune cells (O), macrophages (P) and neutrophils (Q) recruited over time in wounded and unwounded WT and unwounded and wounded Ras+ larvae. R. Graph showing the number of preneoplastic cells receiving contact by immune cells in unwounded/wounded larvae over time (P = 0.0052 for 5 days postwound). |
| Genes: | |
|---|---|
| Fish: | |
| Condition: | |
| Anatomical Terms: | |
| Stage Range: | Protruding-mouth to Days 7-13 |
| Fish: | |
|---|---|
| Condition: | |
| Observed In: | |
| Stage Range: | Protruding-mouth to Day 5 |