
Fig. 4
- ID
- ZDB-FIG-151001-29
- Publication
- Percival et al., 2015 - Variations in sister chromatid cohesion dysfunction in esco2 mutant zebrafish reflects the phenotypic diversity of Roberts Syndrome
- Other Figures
- All Figure Page
- Back to All Figure Page
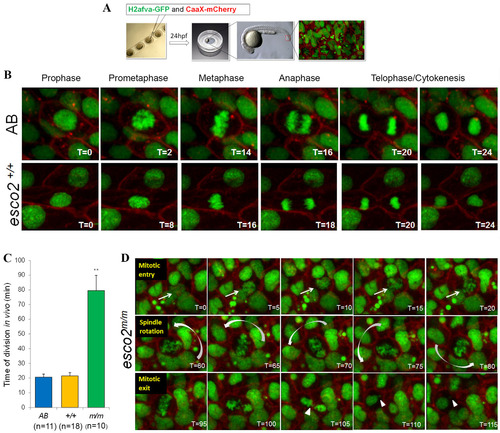
In vivo analysis of esco2 mutants reveals chromosome scattering and a prolonged division time. (A) Schematic of in-embryo confocal imaging. Embryos are injected at the one-cell stage, embedded in low-melt agarose at 24hpf in a coverslip-bottom dish, and visualized with confocal imaging focusing on the thinner tail region. (B) Stills extracted from time-lapse imaging videos of wild-type embryos emphasizing phases of mitosis beginning at prophase and ending at the formation of two daughter cells. Time stamps are in minutes. (C) Division time of AB, esco2+/+ and esco2m/m calculated from nuclear envelope breakdown (NEB) to division into two daughter cells in minutes (mean±s.d., **P<0.01 derived from comparing m/m to either AB or +/+). (D) Time-lapse imaging stills extracted from videos depict esco2 mutant′s mitotic entry, spindle rotation and scattering, and mitotic exit resulting in micronuclei formation (arrowhead). Arrows point towards the cell of interest. Curved arrows orient to the direction of spinning. Time stamps are in minutes. |
| Fish: | |
|---|---|
| Observed In: | |
| Stage: | Prim-5 |