
Fig. S8
- ID
- ZDB-FIG-150924-18
- Publication
- Seiler et al., 2015 - Mutagenesis Screen Identifies agtpbp1 and eps15L1 as Essential for T lymphocyte Development in Zebrafish
- Other Figures
- All Figure Page
- Back to All Figure Page
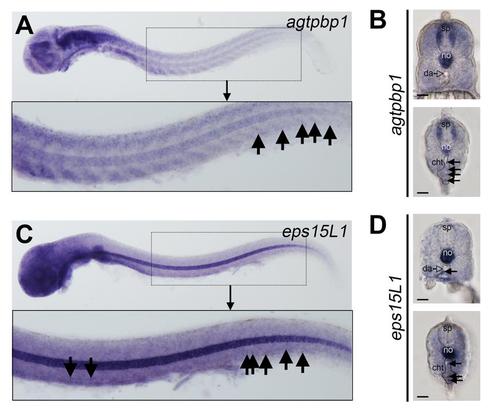
Whole mount expression analysis of agtpbp1 and eps15L1. (A-D) WISH of the indicated genes in 2 dpf embryos. (A) Agtpbp1 expression is shown in purple. Image shows a lateral view of a representative embryo, anterior facing left. Embryo was deyolked. The boxed area is enlarged in the lower panel. Black arrows indicate agtpbp1-expressing cells in the caudal hematopoietic tissue (CHT). (B) Transverse sections through the trunk (top panel) and tail (bottom panel) regions to show agtpbp1 expression in a 2-dpf embryo. Black arrows in the lower panel indicate positive cells in the CHT. (C) Eps15L1 expression is shown in purple. Image shows a lateral view of a representative embryo, anterior facing left. Embryo was deyolked. The boxed area is enlarged in the lower panel. Black arrows indicate positive cells in the AGM and CHT. (D) Transverse sections through the trunk (top panel) and tail (bottom panel) regions to show eps15L1 WISH analysis in a 2-dpf embryo. Black arrows indicate positive cells in the ventral wall of the dorsal aorta (da; AGM region) and CHT in the top and bottom panels, respectively. sp = spinal cord, no = notochord, da = dorsal aorta, cht = caudal hematopoietic tissue region. |