
Fig. 4
- ID
- ZDB-FIG-150722-16
- Publication
- Lacoste et al., 2015 - A Convergent and Essential Interneuron Pathway for Mauthner-Cell-Mediated Escapes
- Other Figures
- All Figure Page
- Back to All Figure Page
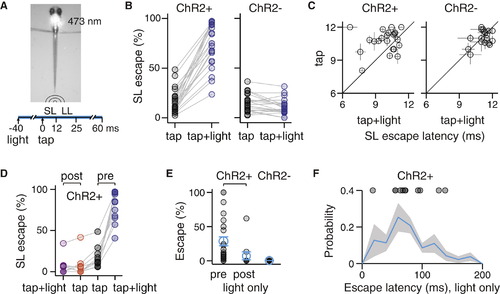
Activation of Spiral Fiber Neurons Enhances the Probability of M-Cell-Mediated Escapes (A) 473-nm blue light is shone on the hindbrain of Tg(–6.7FRhcrtR:gal4VP16); Tg(14xUAS-E1b:hChR2(H134R)-EYFP) larvae using a focused laser beam for a total of 100 ms. 20–60 ms after the onset of the light, a low-intensity tap is delivered, and tail movements are scored for short-latency (SL) or long-latency (LL) escapes. (B) Percentage of SL escapes for individual fish in response to taps alone (black circles) and taps paired with blue light (blue circles). Left: ChR2+ fish (n = 22; 17% ± 4.9% tap, 73.4% ± 4.7% tap + light, mean ± SEM, corresponding to a 4.4-fold enhancement of SL escapes with blue light; p = 4.0 × 10⁻⁵). Right: ChR2– controls (n = 22; 15% ± 1.9% tap, 11% ± 1.7% tap + light, corresponding to a 1.4-fold decrease of SL escapes with blue light; p = 0.01, Wilcoxon signed-rank test). (C) SL escape latency in milliseconds in response to taps (y axis) or taps paired with blue light (x axis) for individual fish tested (black circles). Left: ChR2+ fish (n = 22; 11 ± 0.22 ms tap, 9.9 ± 0.27 ms tap + light, mean ± SEM; p = 0.01). Right: ChR2– fish (n = 22; 11 ± 0.14 ms tap, 11 ± 0.13 ms ms tap + light; p = 0.72, Wilcoxon signed-rank test). (D) Percentage of SL escapes in response to taps or taps paired with light before (pre) or after (post) bilateral spiral fiber neuron ablations. (n = 11 ChR+ larvae; pre: 17% ± 3.7% tap, 78 ± 5.4% tap + light, mean ± SEM, corresponding to a 4.7-fold enhancement; p = 9.8 × 10⁻⁴; post: 6.3% ± 3.5% tap, 5.6 ± 2.9% tap + light, p = 0.58; Wilcoxon signed-rank test). Data in the pre condition are a subset of the data in (B). (E) Percentage of escapes for individual fish (black circles, mean ± SEM in blue) in response to blue light alone (in the absence of taps). ChR2+ fish before (pre; n = 22) and after (post; n = 11) spiral fiber neuron ablations. ChR2– fish, n = 22. (F) Distribution of escape latencies in ChR2+ fish after the onset of a 100-ms blue light pulse (blue line ± shaded SEM; n = 185 escapes, n = 11 fish). Circles represent the mean of escape latencies for larvae displaying >10% probability of escapes (see “pre” in E; n = 11). Note: to ensure that escapes to blue light alone could be disambiguated with escapes in response to taps paired with light, larvae that responded to blue light alone with mean escapes latencies <70 ms were tested with a 20-ms delay between taps and blue light; otherwise, 40- or 60-ms delays were used (see A). See also the Supplemental Experimental Procedures. ChR2, channelrhodopsin 2; LS, short latency; LL, long latency. See also Figure S3. |