
Fig. 2
- ID
- ZDB-FIG-150722-14
- Publication
- Lacoste et al., 2015 - A Convergent and Essential Interneuron Pathway for Mauthner-Cell-Mediated Escapes
- Other Figures
- All Figure Page
- Back to All Figure Page
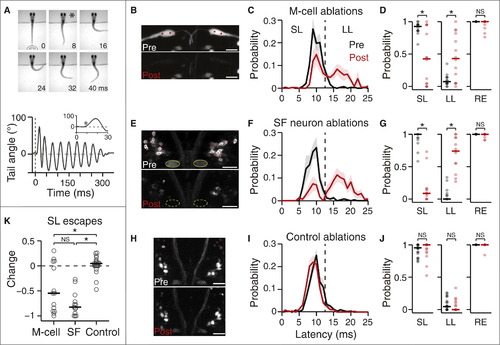
Loss of M-Cells or Spiral Fiber Neurons Largely Abolish Short-Latency Escapes (A) Top: representative escape behavior of a head-embedded larval zebrafish responding to a tap stimulus. Images were recorded every millisecond, and here every eighth image is shown. The first image was taken at the time the tap stimulus hit the dish holding the larvae. The image marked with a star corresponds to the beginning of the escape response (8 ms latency). Bottom: representative smoothed tail trace showing the angle of the last tail segment with respect to the vertical in response to a tap. The escape behavior consists of a sharp-angle C-bend, followed by a counter turn in the opposite direction and subsequent swimming lasting hundreds of milliseconds. The dotted line shows the stimulus. The inset shows the first 300 ms after stimulus onset and the star indicates the start of the C-bend. (B–J) Results of M-cell ablations (B–D; n = 14 fish), spiral fiber (SF) neuron ablations (E–G; n = 13), and control ablations (H–J; n = 23) on the escape behavior in response to taps. (B, E, and H) Stack projections showing before (top) and immediately after (B) or 24 hr after (E and H) two-photon laser-mediated bilateral ablations (bottom). Shown are Et(fos:Gal4-VP16)s1181t; Tg(UAS:GCaMP-HS) (B) and Tg(–6.7FRhcrtR:gal4VP16); Tg(UAS-E1b:Kaede) (E and H). Red dots mark the cells or location within the M-cell that were targeted for ablation. Green ovals in (E) mark the axon caps, which are no longer apparent 24 hr after ablations. High-fluorescence cell debris can be observed in the post images. (C, F, and I) Escape probability as a function of latency of all escapes performed, mean ± SEM, before (black) and after (red) ablations. The dotted line at 13 ms demarcates short-latency (f12 ms) and long-latency (13–25 ms) escapes. (D, G, and J) Probabilities of different types of responses as a function of all trials before (black) and after (red) ablations. Individual fish are displayed as semi-transparent dots, and horizontal bars are the medians. Left, SL escapes; middle, LL escapes; right, overall responses. M-cell: p = 0.013 pre versus post (SL), 0.016 (LL), and 0.125 (RE); spiral fiber neuron: p = 2.4 × 10⁻⁴, p = 2.4 × 10⁻⁴, and p = 0.25; control: p = 0.28, p = 0.20, and p = 1; Wilcoxon signed-rank test. (K) Change in SL escape probability as a function of all trials (post – pre) based on the SL data plotted in (D), (G), and (J). Gray circles, individual fish; black line, median. M-cell versus spiral fiber neurons, p = 0.11; M-cell versus control, p = 0.011; spiral fiber neurons versus control, p = 1.6 × 10⁻⁶; Wilcoxon rank-sum test. p < 0.05; NS, not significant. Pictures are oriented rostral up. Scale bars represent 20 µm. SF, spiral fiber; LS, short latency; LL, long latency; RE, overall response. See also Figure S2. |