
Fig. 2
- ID
- ZDB-FIG-150520-23
- Publication
- Agapakis et al., 2011 - Towards a synthetic chloroplast
- Other Figures
- All Figure Page
- Back to All Figure Page
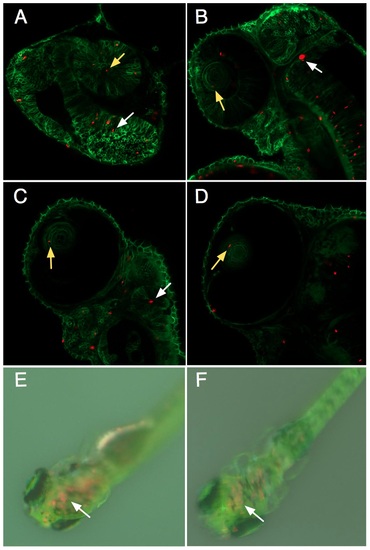
Tracking intracellular S. elongatus through zebrafish development. Single optical slice confocal microscopy images of the anterior of the zebrafish embryo at A.) Day 1 post injection, B.) Day 2, C.) Day 3, D.) Day 4, and dissecting microscope images of embryos E.) Day 8, F.) Day 12 post injection. Zebrafish cell membranes are outlined in green, with red autofluorescent bacteria visible in cells throughout the embryo, including the eye (yellow arrows) and brain (white arrows). Red autofluorescence gradually decreased over the course of experimental observations, but remained visible in the brain of the young zebrafish even after 12 days. |