
- Title
-
Towards a synthetic chloroplast
- Authors
- Agapakis, C.M., Niederholtmeyer, H., Noche, R.R., Lieberman, T.D., Megason, S.G., Way, J.C., and Silver, P.A.
- Source
- Full text @ PLoS One
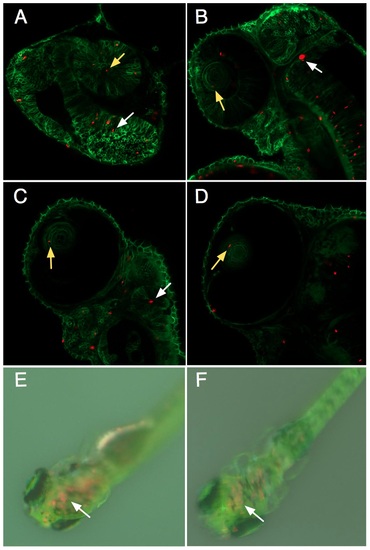
Tracking intracellular S. elongatus through zebrafish development. Single optical slice confocal microscopy images of the anterior of the zebrafish embryo at A.) Day 1 post injection, B.) Day 2, C.) Day 3, D.) Day 4, and dissecting microscope images of embryos E.) Day 8, F.) Day 12 post injection. Zebrafish cell membranes are outlined in green, with red autofluorescent bacteria visible in cells throughout the embryo, including the eye (yellow arrows) and brain (white arrows). Red autofluorescence gradually decreased over the course of experimental observations, but remained visible in the brain of the young zebrafish even after 12 days. |
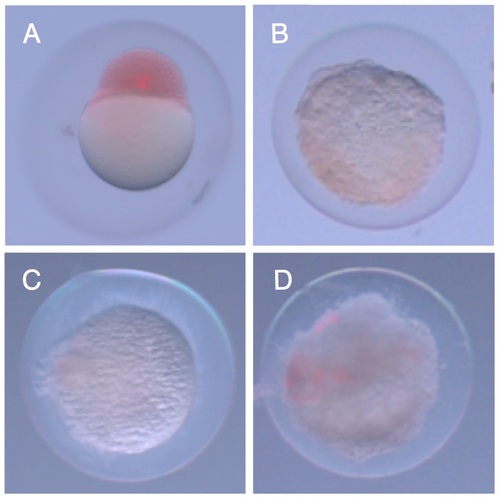
Zebrafish embryos are immediately killed by E. coli. A.) Zebrafish embryo two hours after injection of S. elongatus. Cells appear red due to phenol red present in the injection buffer. B.) Injection of E. coli led to drastic morphological changes in the embryo after two hours, and this change was observed with E. coli cells that were C.) UV killed, or D.) ΔmsbB mutants. |

S. elongatus can grow inside the macrophage cytoplasm.
A.) Time lapse microscopy of macrophages infected with +inv+llo S. elongatus kept in the dark shows the gradual decrease in red autofluorescence over the course of 12 hours. In contrast, when kept in the light, B.) empty vector S. elongatus autofluorescence is observed to gradually decrease over the course of several days (top row), while a significant increase in red S. elongatus autofluorescence was observed in macrophages infected with inv llo S. elongatus for two days post-infection (bottom row). This fluorescence was observed to decrease after the third day of infection. C.) This change in fluorescence over time can be quantified as a change in background subtracted mean fluorescence in ImageJ and averaged over triplicate experiments. Empty vector (blue line) and +inv+llo S. elongatus (red line) show marked differences in growth when infected at similar densities of 1–2 bacterial cells per macrophage. D.) +inv+llo S. elongatus displayed infection density dependent growth rates in macrophages. Each line shows change in mean fluorescence in cells infected at a single starting density, ranging in multiples of two from fewer than one cell per macrophage to approximately 4 bacteria per macrophage. E.) Macrophage cell counts were variable across replicates and over the course of the experiment but displayed no significant difference between macrophages infected with empty vector S. elongatus at low (green line) or high density (blue line), or +inv+llo S. elongatus at low (red line) or high (yellow line) density. F.) When infected at low density of fewer than one bacteria per macrophage, S. elongatus division was observed during 18 hour time-lapse fluorescent microscopy in approximately 1% of macrophages observed, in particular those cells that contained more than one bacterial cell due to stochastic fluctuations. |