
Fig. 7
- ID
- ZDB-FIG-150511-6
- Publication
- Lagman et al., 2015 - Transducin Duplicates in the Zebrafish Retina and Pineal Complex: Differential Specialisation after the Teleost Tetraploidisation
- Other Figures
- All Figure Page
- Back to All Figure Page
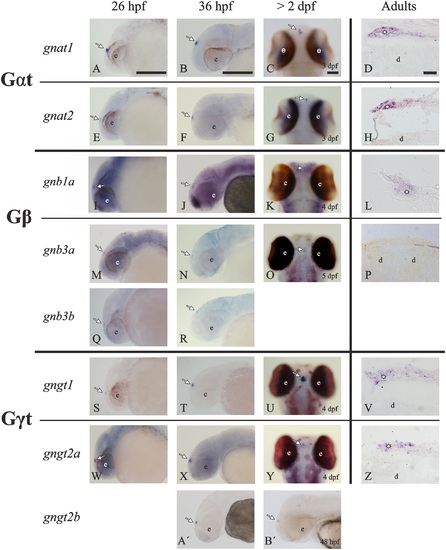
Summary of the transducin subunit gene ontogeny in the zebrafish pineal complex. The photomicrographs show the presence of mRNAs for the transducin genes in the pineal complex of zebrafish. In adults, transversal sections from the dorsal diencephalon show expression of gnat1 (D), gnat2 (H), gnb1a (L), gngt1 (V) and gngt2a (Z) in the pineal complex (asterisks) but not in the dorsal diencephalon (d). Observe the complete lack of mRNA for the gnb3a gene (P). The ontogenetic analysis shows a synchronised onset and development of expression starting at around 26 hpf for gnat1 (A-C), gnat2 (E-G), gnb1a (I-K), gnb3a (M-O), gngt1 (S-U) and gngt2a (W-Y). In addition, there is a transient expression of gnb3b (Q, R) and gnbt2b (A′, B′) in the pineal complex prior to hatching. Note the background-like expression found in the early stages for gnb1a (I-K), gnb3a (M, N) and gngt2a (W-Y). In all cases, arrows point to the location of the pineal complex, and “e” mark the location of the eyes. The photomicrographs in panels C, G, K, O, U and Y show a dorsal view of the larvae, while the others show lateral views. Scale bars: 50 µm in larvae and 30 µm in adults. For abbreviations see Fig. 2 legend. |
| Genes: | |
|---|---|
| Fish: | |
| Anatomical Term: | |
| Stage Range: | Prim-5 to Adult |