
Fig. 4
- ID
- ZDB-FIG-150506-17
- Publication
- Campbell et al., 2015 - Dynamic visualization of transcription and RNA subcellular localization in zebrafish
- Other Figures
- All Figure Page
- Back to All Figure Page
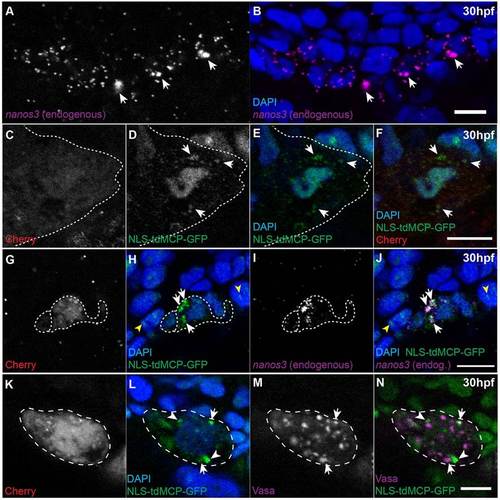
MS2-tagged nos3′utr colocalizes with endogenous nanos3 and a subset of Vasa-positive germ granules in PGCs. (A,B) Endogenous nanos3 RNA localizes to PGCs at 30hpf and is present throughout the cytoplasm and in larger perinuclear accumulations (arrows). Scale bar: 10µm. (C-F) Cherry-positive cells at 30hpf have diffuse cytoplasmic MCP-GFP signal and larger perinuclear accumulations (arrows). Scale bar: 10µm. (G-J) Accumulations of MCP-GFP in Cherry-expressing PGCs at 30hpf in cherry-24xMBS-nos3′UTR-injected embryos (white arrows) colocalize with endogenous nanos3 accumulations. Nonspecific nuclear aggregates of MCP-GFP (yellow arrowheads) do not colocalize with endogenous nanos3, consistent with these structures being artifacts. Scale bar: 25µm. (K-N) A subset of MCP-GFP accumulations in Cherry-expressing PGCs at 30hpf in cherry-24xMBS-nos3′UTR-injected embryos coincide with Vasa protein-positive germ granules (arrows) whereas others do not (arrowheads). Scale bar: 10µm. The dotted lines denote borders of cells expressing Cherry reporter. |