
Fig. 2
- ID
- ZDB-FIG-150506-15
- Publication
- Campbell et al., 2015 - Dynamic visualization of transcription and RNA subcellular localization in zebrafish
- Other Figures
- All Figure Page
- Back to All Figure Page
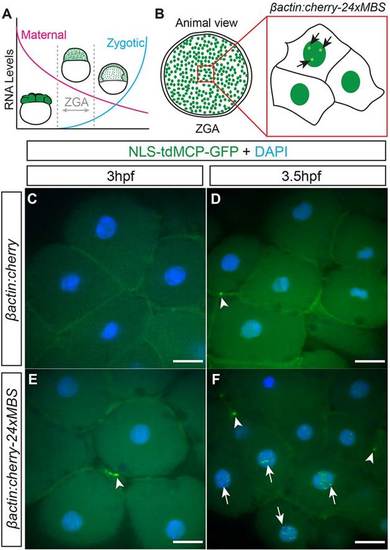
MS2-labeling reveals the onset of transcription in zebrafish embryos. (A) Immediately after fertilization, the RNA present is exclusively comprised of maternal products. After ZGA, zygotic transcripts begin to accumulate and replace maternal transcripts. (B) Embryos were injected with DNA encoding MS2-tagged-cherry RNA expressed from the βactin promoter and assayed for nuclear puncta around the time of ZGA (3-4.5hpf). (C-F) Animal pole view of fixed embryos showing that βactin:cherry-injected control embryos at (C) 3hpf and (D) 3.5hpf have no nuclear puncta. Animal pole views of fixed embryos injected with βactin:cherry-24xMBS at (E) 3hpf and (F) 3.5hpf showing that nuclear puncta (arrows) are not detected at 3hpf but are apparent at 3.5hpf and beyond. Both injected (C-F) and uninjected (supplementary material Fig. S2) embryos display accumulations of MCP-GFP at cell membranes (arrowheads). Scale bars: 25µm. |