
Fig. 2
- ID
- ZDB-FIG-150430-28
- Publication
- Akiyama et al., 2014 - An anterior limit of FGF/Erk signal activity marks the earliest future somite boundary in zebrafish
- Other Figures
- All Figure Page
- Back to All Figure Page
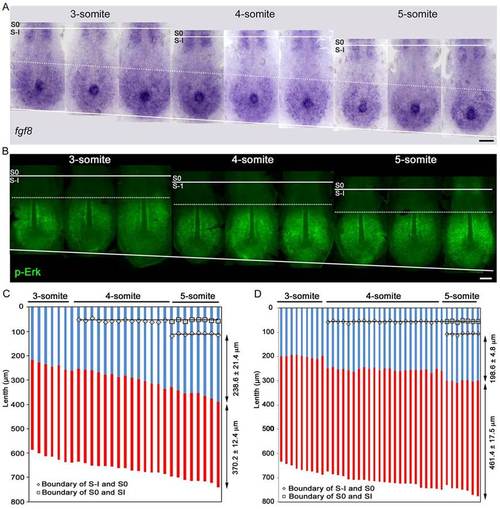
A continuous pattern of fgf8a mRNA is converted into a stepwise pattern of p-Erk during each somite segmentation. (A) Representative images of fgf8a expression in the tailbud regions of embryos at the 3- to 5-somite stages. The position of the anterior extremity of fgf8a expression is indicated by the dotted line. (B) Representative images of p-Erk distribution in the tailbud regions of embryos at the 3- to 5-somite stages. Dorsal view of tailbud regions, anterior to the top. (C,D) Quantitative data of fgf8a expression (C) or p-Erk distribution (D). Embryos (C, n=29; D, n=39) were arranged in order of time progression, which was estimated by both the somite number and the PSM length. In C, red and blue stripes within each column indicate expression and non-expression domains of fgf8a in each embryo, respectively. Statistical significance of variation (2P<0.05) could be seen in fgf8a expression region (C.V.=0.033) versus fgf8a non-expression region (C.V.=0.090). In D, red and blue stripes within each column indicate ON and OFF regions of Erk activity in each embryo, respectively. Scale bars: 100 µm. Statistical significance of variation (2P<0.05) could be seen in the OFF region (C.V.=0.024) versus the ON region (C.V.=0.038). |
| Gene: | |
|---|---|
| Antibody: | |
| Fish: | |
| Anatomical Term: | |
| Stage Range: | 1-4 somites to 5-9 somites |