
Fig. 8
- ID
- ZDB-FIG-150430-23
- Publication
- Hui et al., 2014 - Genome wide expression profiling during spinal cord regeneration identifies comprehensive cellular responses in zebrafish
- Other Figures
- All Figure Page
- Back to All Figure Page
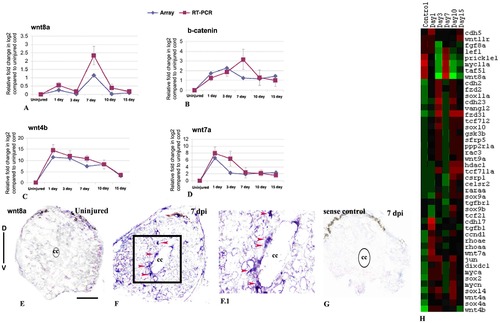
Differentially expressed genes involved in Wnt signaling pathway in zebrafish spinal cord after injury and validation of wnt8a, wnt4b, wnt7a and b-catenin: A–D) Quantitative RT-PCR analysis of wnt8a, b-catenin, wnt4b and wnt7a respectively showing fold change (red graph) and temporal expression pattern after injury. Pattern of expression was compared with microarray data (blue graph). Error bars represent SEM, n = 3, p<0.01. E–F) In situ hybridization with wnt8a anti-sense probe showed absence and presence of mRNA transcripts in uninjured and 7 dpi cord respectively. F.1) Higher magnification of the boxed area in section F shows wnt8a expression in ependymal cells (red arrowheads). G) In situ hybridization of 7 dpi section with wnt8asense probe as control. ‘D’ and ‘V’ indicates dorsal and ventral side of the cord respectively. The mark ‘cc’ denotes central canal of the cord. H) Represents temporal expression pattern of genes after SCI related to Wnt signaling pathway. The color chart indicates mean fold change of gene expression in each time points. Red and green colors represent increased and decreased expression respectively. Scale bar = 50 µm. |
| Genes: | |
|---|---|
| Fish: | |
| Condition: | |
| Anatomical Terms: | |
| Stage: | Adult |
| Fish: | |
|---|---|
| Condition: | |
| Observed In: | |
| Stage: | Adult |