
Fig. 6
- ID
- ZDB-FIG-150430-21
- Publication
- Hui et al., 2014 - Genome wide expression profiling during spinal cord regeneration identifies comprehensive cellular responses in zebrafish
- Other Figures
- All Figure Page
- Back to All Figure Page
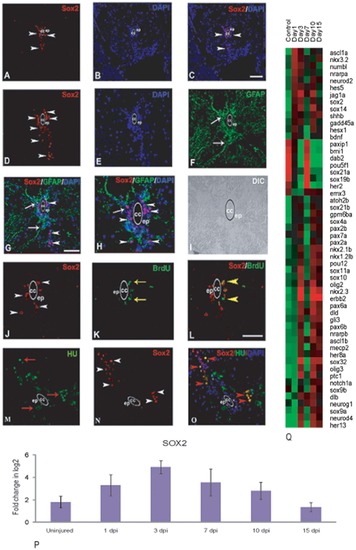
Differentially expressed genes involved in neurogenesis and neuronal differentiation after injury in zebrafish spinal cord and validation of Sox2 expression by immunohistochemistry and qRT-PCR analysis. A–C) A cross section of uninjured cord showing SOX2 positive cells (white arrowhead) in ependyma (ep) around the central canal (cc), counter stained with DAPI (B) and merge (C). D) A cross section of 3 dpi cord showing higher number of SOX2 positive cells compared to uninjured (A) in grey matter (white arrowhead) mostly in ependyma (ep) around the central canal (cc). E–F) Same 3 dpi cord section counter stained with DAPI (E) and stained with radial glial marker GFAP (F). G) Same 3 dpi cord section showing both SOX2 positive cells (arrowheads) and their colocalization with GFAP (arrow). H) Same section (G) in higher magnification showing colocalized SOX2 and GFAP positive cells (arrow) around the central canal (cc), I) DIC of same section in H. J–L) 3 dpi cord section showing SOX2 positive cells (J, arrowheads) and BrdU positive cells (K, yellow arrow) in the grey matter and many of them are SOX2+/BrdU+ (L, yellow arrowheads) in ependyma (ep) around the central canal (cc). M–O) A 3 dpi cord section showing many HuC/D positive neuronal cells (M, red arrow) and SOX2 positive cells (N, white arrowheads) in the grey matter. Same section showing colocalization of SOX2 and HuC/D (O, red arrowheads). P) qRT-PCR of sox2 in uninjured cord and in injured cord at different time points. Error bars represent SEM, n = 3, p<0.05. Q) Dendrogram showing differentially expressed genes involved in neurogenesis and neuronal differentiation after injury. Each horizontal line indicates the expression pattern of each gene and the vertical columns indicate the uninjured control and time points after SCI. The color chart indicates mean fold change of gene expression in each time points. Red and green colors represent increased and decreased expression respectively. Scale bar = 50 µm (A–G and M–O), 20 µm (H–L). |
| Gene: | |
|---|---|
| Fish: | |
| Condition: | |
| Anatomical Terms: | |
| Stage: | Adult |
| Fish: | |
|---|---|
| Condition: | |
| Observed In: | |
| Stage: | Adult |