
Fig. 5
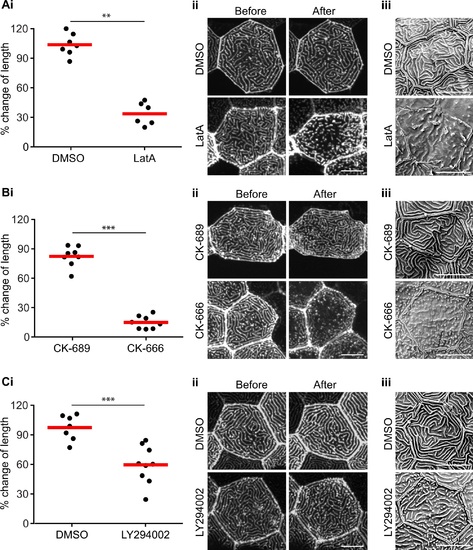
Microridges are actively treadmilling. Inhibition of actin polymerization using Latrunculin A (LatA) (A) or inhibition of Arp2/3 using CK-666 (B) resulted in shortened microridges. Larvae at 2.5 dpf were treated with 1 µM LatA or 0.5% DMSO as controls for 30 minutes, or with 200 µM CK-666 or its inactive analogue CK-689 for 1 hour. (C) PI3K kinase activity is involved in maintaining microridge length. Larvae at 2.5 dpf were treated with 130 µM LY294002 for 1 hour to inhibit PI3K. 0.5% DMSO was used as a control. (Ai, Bi and Ci) The length of microridges in the same cell before and after treatment was measured and compared. Each data point represents the percentage change of average microridge length in one cell after treatment. Data are representative of at least three separate experiments. Each experiment was performed on at least 3 larvae, with microridge measurements on 3–4 cells per larva. For details of the methods and analysis refer to the Methods and Materials section. ** P<0.01; *** P<0.001 (two-tailed, unpaired t-test). (Aii, Bii and Cii) Representative confocal images of GFP-UtrCH labeled microridges before and after the respective treatments. Scale bar, 10 µm. (Aiii, Biii and Ciii) Representative scanning electron microscopy images of zebrafish larvae with the respective treatments. Scale bar, 10 µm |