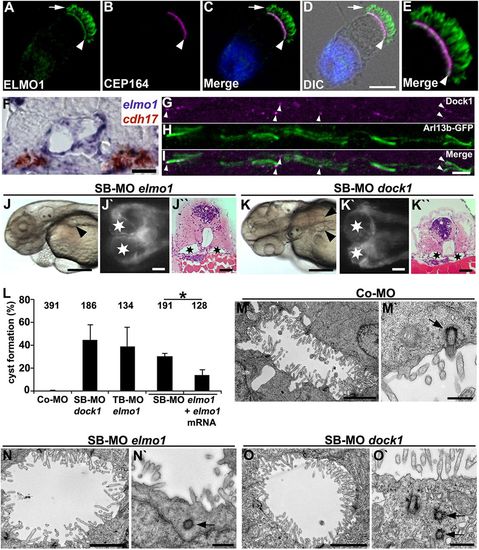
ELMO1 and DOCK1 show expression in cilia in human and zebrafish and are required for ciliogenesis in zebrafish. (A-E) Human respiratory epithelial cells from healthy controls were double labelled with antibodies against ELMO1 (green) and CEP164 (magenta). ELMO1 localises along the ciliary axonemes (arrow) and the basal bodies (arrowhead). The nucleus is stained with Hoechst 33342 (blue). (F) Transverse section of a 24 hpf zebrafish embryo reveals that elmo1 mRNA expression (blue) partially colocalises with cadherin 17 (cdh17) mRNA (red) in the pronephric tubule. (G-I) Dock1 is expressed at the base of the cilium (arrowheads) and ciliary axonemes (green fluorescence of Arl13b-GFP) in 48 hpf Tg(actb2:Mmu.Arl13b-GFP) zebrafish embryos. (J-K′′) Expression silencing of elmo1 (J-J′′) and dock1 (K-K′′) using SB-MO elmo1 (2 ng) and SB-MO dock1 (2 ng), respectively, resulted in pronephric cyst formation (arrowheads and stars), as shown in a bright-field lateral view with anterior to the left (J,K), a dorsal view with anterior to the left of a Tg(wt1b:EGFP) embryo (J′,K′), and in a transverse section (J′′,K′′) of 48 hpf embryos. (L) Quantification of pronephric cyst formation in 48 hpf zebrafish embryos injected with Co-MO, SB-MO dock1, TB-MO elmo1 and SB-MO elmo1 (each 2 ng) or SB-MO elmo1 (2 ng) + elmo1 mRNA (20 pg). There was significant prevention of cyst formation upon co-injection of elmo1 mRNA (*P <= 0.05). The number of individual embryos analysed is indicated above each bar. (M-O′) Analysis of electron micrographs revealed basal body docking defects (arrows) in 48 hpf zebrafish embryos injected with SB-MO elmo1 (2 ng) (N,N′) or SB-MO dock1 (2 ng) (O,O′) as compared with Co-MO (2 ng) (M,M′). Scale bars: 10 μm in D; 20 μm in F,J′,K′ ; 100 μm in I; 50 μm in J,K,J′′,K′′ ; 2 μm in M,N,O ; 0.5 μm in M′,N′,O′.
|
