
Fig. 6
- ID
- ZDB-FIG-150326-47
- Publication
- Skaggs et al., 2014 - Excitotoxic brain injury in adult zebrafish stimulates neurogenesis and long-distance neuronal integration
- Other Figures
- All Figure Page
- Back to All Figure Page
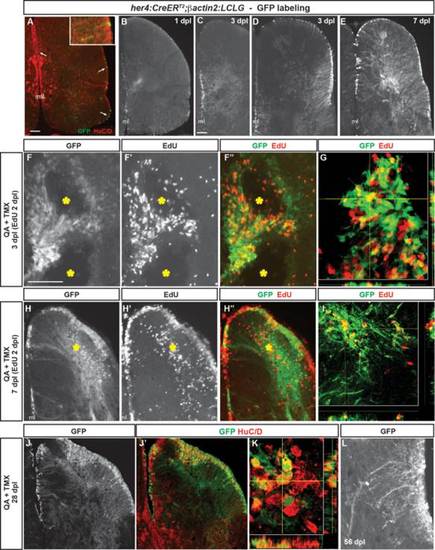
Radial glia-specific lineage mapping shows NPC activation, increased neurogenesis and migration to injury after QA-induced telencephalic lesioning. (A–A′′) A double transgenic zebrafish Tg(her4:CreERT2;β-actin2:LCLG) received tamoxifen intraperitoneally for 4 days and was examined 4 weeks later. Scattered GFP+ cells (green in A′′) appeared in the VZ (arrows) which generated a very small number of GFP+ neurons that extended a short distance from the ventricular surface and coexpressed the neuronal marker HuC/D (red; inset in A′′). (B) A modest amount of GFP expression was observed in the VZ at 1 dpl after intratelencephalic injection of QA and tamoxifen. (C,D) By 3 days after injury, the GFP+ progenitor population expanded in both the medial (C) and lateral (D) periventricular regions. (E) By 7 dpl, many GFP+ cell bodies were observed in the VZ, periventricular regions and parenchyma of the QA-lesioned hemisphere, indicating migration to injury, and an extensive network of GFP+ processes extended from the VZ to the lesion site. (F–F′′) Pulse-chase labeling with EdU (red in F′′) administered 2 dpl revealed that, as early as 1 day later, newborn cells derived from GFP+ radial glia extend toward the lesion site (yellow asterisks). (G) Orthogonal projection shows a cell colabeled with GFP and EdU that has migrated from the VZ. (H,I) Many GFP+ cell bodies that incorporated EdU at 2 dpl appeared in the parenchyma by 7 dpl while others remained in the ventricular/periventricular regions. Large numbers of GFP+ processes also extend from the ventricular region to the injury (yellow asterisk). (J,K) Many GFP+ cells (green) in both the parenchyma and periventricular regions remained at 28 dpl and coexpressed the neuronal marker HuC/D (red). (L) In contrast to their appearance as long, unelaborated processes at 3 dpl (see C,D), by 56 days after QA injection, GFP+ cells exhibit processes with highly branched, mature morphology. Scale bar = 100 µm. Scale bar in A applies to B. Scale bar in C applies to D, E, H, J. Scale bar in F applies to L. ml = midline. |