
FIGURE
Fig. 5
- ID
- ZDB-FIG-150115-6
- Publication
- Hartsock et al., 2014 - In vivo analysis of Hyaloid vasculature morphogenesis in zebrafish: A role for the lens in maturation and maintenance of the Hyaloid
- Other Figures
- All Figure Page
- Back to All Figure Page
Fig. 5
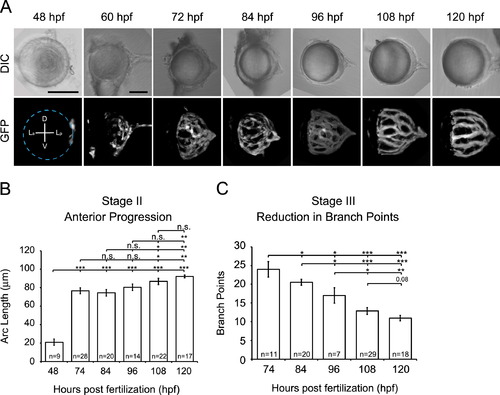
Quantification of hyaloid growth. (A) DIC and GFP maximum projections images of dissected lenses from fli1a:GFP embryos at 12 h intervals from 2 to 5 dpf. Dashed line indicates location of the lens. Scale bars=50 µm. D: Dorsal, V: Ventral, La: Lens anterior, Lp: Lens posterior (B) Quantification of anterior progression of the hyaloid over time. (C) Reduction in hyaloid vessel branching over time. *p≤0.01, **p≤0.001, ***p≤1×10⁻¹⁰. n=number of samples analyzed. |
Expression Data
| Gene: | |
|---|---|
| Fish: | |
| Anatomical Terms: | |
| Stage Range: | Long-pec to Day 5 |
Expression Detail
Antibody Labeling
Phenotype Data
Phenotype Detail
Acknowledgments
This image is the copyrighted work of the attributed author or publisher, and
ZFIN has permission only to display this image to its users.
Additional permissions should be obtained from the applicable author or publisher of the image.
Reprinted from Developmental Biology, 394(2), Hartsock, A., Lee, C., Arnold, V., Gross, J.M., In vivo analysis of Hyaloid vasculature morphogenesis in zebrafish: A role for the lens in maturation and maintenance of the Hyaloid, 327-39, Copyright (2014) with permission from Elsevier. Full text @ Dev. Biol.