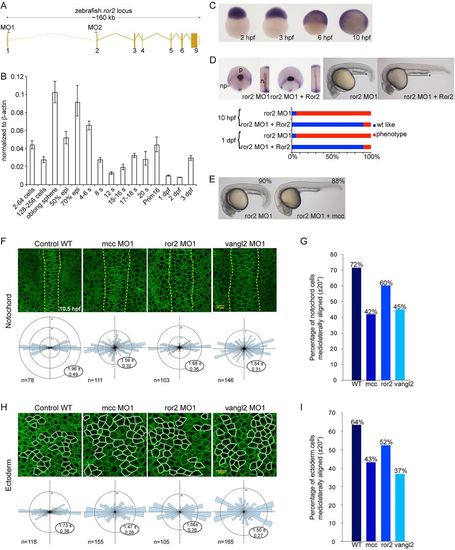
ror2 is required for convergence and extension in zebrafish and acts upstream of mcc. (A) Schematic of the ror2 locus, with the position of splice junction MOs (MO1 and MO2) indicated. (B) Q-PCR analysis of ror2 expression in developing zebrafish. Maternal ror2 transcripts are detected from 2-256 cells, with dynamic expression over the next 3days. Data are normalized to β-actin. Error bars indicate s.e.m. epi, epiboly; s, somite. (C) ror2 WISH at the indicated stages. (D) Injection of ror2 MO1 results in CE defects at 10hpf, as assessed by ntl, dlx3 and hgg1 triple in situ hybridization; these defects are robustly rescued at 10hpf and 1dpf by mouse Ror2 mRNA. The solid black line with asterisk emphasizes the shortened yolk extension at 1dpf, and the curved dotted line highlights the smaller eyes and head in ror2 morphants compared with wild type. np, neural plate; p, polster; n, notochord. (E) Co-injection of ror2 MO1 and zebrafish mcc mRNA results in ostensibly normal embryos at 1dpf. (F,H) Membrane GFP-labeled notochord (F) and dorsal ectoderm (H) cells of wild type and mcc, ror2 or vangl2 morphants as indicated at 90-95% epiboly (9.5-10hpf). Dorsal view with anterior upwards. The notochord boundary in F is marked by vertical dashed yellow lines. Note the extra columns of cells in the morphant notochords. Dorsal ectoderm cells selected for morphometric analysis are outlined in H in white. The number of cells analyzed (n) and length-to-width (LWR) ratios (expressed as mean±s.e.m.) are indicated in the Rose diagrams, which depict cell orientation relative to the embryonic anterior-posterior axis (vertical dashed line). (G,I) The percentage of mediolaterally aligned cells with a longitudinal axis oriented ±20° with respect to the embryonic mediolateral axis (horizontal dashed line in the Rose diagrams). (D,E,F,H) MO and mRNA concentrations are provided in supplementary material Table S3, with scored embryo counts listed in supplementary material Table S4.
|
