
Fig. 2
- ID
- ZDB-FIG-141124-10
- Publication
- Tsuji et al., 2014 - Whole Organism High Content Screening Identifies Stimulators of Pancreatic Beta-Cell Proliferation
- Other Figures
- All Figure Page
- Back to All Figure Page
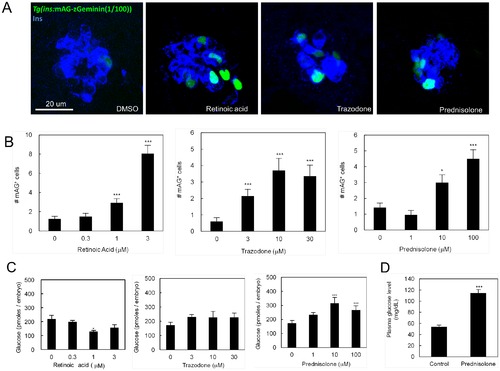
Retinoic acid and Trazodone promote beta-cell proliferation without inducing hyperglycemia. (A) Confocal images of Tg(ins:mAG-zGeminin(1/100))s947 + beta-cells (green) stained for Insulin (blue). The animals were treated with 1 µM retinoic acid, 10 μM trazodone or 10 μM prednisolone in 1% DMSO (scale bar = 20 μm). (B) Dose–response curves for Tg(ins:mAG-zGeminin(1/100))s947 + beta-cells showing the relationship between the concentration of the compounds and the number of proliferating beta-cells in larvae treated with retinoic acid, trazodone, or prednisolone in 1% DMSO from 3 to 4 dpf. Error bars represent SEM. *P<0.05, and ***P<0.005 compared to vehicle-treated controls; n = 16–20 larvae for each group. (C) Absolute glucose values in zebrafish larvae treated with retinoic acid, trazodone, or prednisolone in 1% DMSO. Error bars represent SEM. *P<0.05, and ***P<0.005 compared to vehicle-treated controls; n = 16–20 larvae for each group. (D) Blood glucose concentration in adult zebrafish treated with 30 μM prednisolone for 24 h. Error bars represent SEM. ***P<0.005 compared to vehicle-treated controls; n = 10 fish for each group. |
| Gene: | |
|---|---|
| Antibody: | |
| Fish: | |
| Conditions: | |
| Anatomical Term: | |
| Stage: | Day 4 |