FIGURE
            Fig. S11
- ID
 - ZDB-FIG-141007-53
 - Publication
 - Bielczyk-Maczyńska et al., 2014 - A loss of function screen of identified genome-wide association study Loci reveals new genes controlling hematopoiesis
 - Other Figures
 - All Figure Page
 - Back to All Figure Page


                        Fig. S11


| 


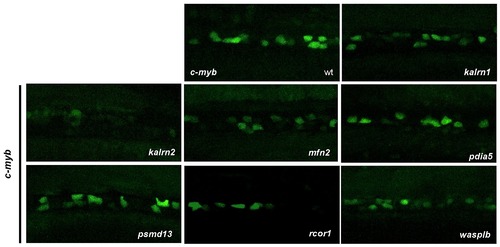
 To assess the HSC emergence in the aorta-gonad-mesonephros (AGM) region, we injected gene-specific MOs in single-cell stage Tg(c-myb:GFP) transgenic embryos. For kalrn1, mfn2, pdia5, psmd13 and wasplb MO injected embryos no difference in the number of HSCs was observed when compared to the control at 30 hpf. However, kalrn2 and rcor1 depleted embryos had a marked decrease in the number of HSCs at 30 hpf, implying an important role of these genes in specification of HSCs in the AGM. Representative images of the AGM region are shown. All embryos are oriented with anterior to the left and dorsal to the top.  | 


                        Expression Data


    | Gene: | |
|---|---|
| Fish: | |
| Knockdown Reagents: | |
| Anatomical Term: | |
| Stage: | Prim-15 | 
                
                    
                        Expression Detail


                        Antibody Labeling


                        Phenotype Data


    | Fish: | |
|---|---|
| Knockdown Reagents: | |
| Observed In: | |
| Stage: | Prim-15 | 
                
                    
                        Phenotype Detail


                        Acknowledgments


This image is the copyrighted work of the attributed author or publisher, and
ZFIN has permission only to display this image to its users.
Additional permissions should be obtained from the applicable author or publisher of the image.
      Full text @ PLoS Genet.