
Fig. S10
- ID
- ZDB-FIG-141007-52
- Publication
- Bielczyk-Maczyńska et al., 2014 - A loss of function screen of identified genome-wide association study Loci reveals new genes controlling hematopoiesis
- Other Figures
- All Figure Page
- Back to All Figure Page
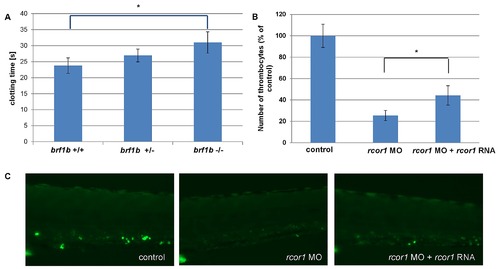
A) Fish heterozygous for a mutation in brf1b (allele sa3097, ZMP) were crossed and their progeny (n = 41) was subjected to a clotting time assay at 5 dpf. The time of clotting after caudal vein puncture was recorded and the larvae were genotyped. Each bar represents average clotting time in the group, SEM is shown. One-tailed Student t test, * p = 0.042. B) A graph to illustrate the number of thrombocytes in control (n = 33), splice rcor1 MO (n = 28) and splice rcor1 MO plus rcor1 mRNA (n = 15) injected embryos. Each bar represents average number of thrombocytes in the group, SEM is shown. One-tailed Student t test, * p = 0.024. C) Representative fluorescent images of embryos in the rcor1 rescue experiment. All embryos are oriented with anterior to the left and dorsal to the top. |