
Fig. S2
- ID
- ZDB-FIG-140922-18
- Publication
- Sasaki et al., 2014 - Aberrant Autolysosomal Regulation Is Linked to The Induction of Embryonic Senescence: Differential Roles of Beclin 1 and p53 in Vertebrate Spns1 Deficiency
- Other Figures
- All Figure Page
- Back to All Figure Page
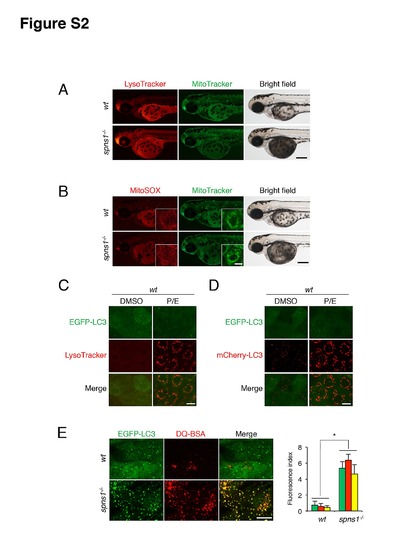
Detection of lysosomal and mitochondrial biogenesis in spns1-mutant animals. (A) Whole-mount double staining of live embryos with LysoTracker (10 μM, DND-99; red) and MitoTracker (1 μM, green) at 72 hpf. Intense LysoTracker staining was detected only in spns1 mutants but not in wt animals. In contrast, MitoTracker detected equivalent signals between wt and spns1-mutant animals. Scale bar, 250 µm. (B) Whole-mount double staining of live embryos with MitoSox (5 μM, red) and MitoTracker (1 μM, green) at 72 hpf. Both of the probes detected equivalent signals between wt and spns1-mutant animals. Scale bar (black) in large image, 250 μm. Scale bar (white) in inset, 10 μm. (C) Acidity-dependent quenching of EGFP-LC3 at the LysoTracker-positive compartments in the cells from pepstatin A (5 μg/ml)- and E-64-d (5 μg/ml)-co-treated (P/E) zebrafish embryos at 72 hpf. Scale bar, 10 μm. (D) Acidity-dependent quenching of EGFP-LC3, but not mCherry-LC3, in cells from pepstatin A (5 μg/ml)- and E-64-d (5 μg/ml)-co-treated (P/E) zebrafish embryos at 72 hpf. Scale bar, 10 μm. (E) The degradation capacity of autolysosomes and lysosomes was examined by injection of a lysosomal substrate, DQ Red BSA (DQ-BSA; red) at 60 hpf. The enzyme-catalyzed hydrolysis of the intramolecular self-quenched DQ Red BSA by lysosomal proteases relieves the self-quenching, yielding brightly fluorescent reaction products. DQ Red BSA-injected wt control or spns1-mutant fish expressing EGFP-LC3 were observed at the cellular level by confocal microscopy. Scale bar, 10 μm. Quantification of data presented in E (n = 6), is shown in the right graph; the number (n) of animals is for each genotype. Three independent areas (periderm or basal epidermal cells above the eye) were selected from individual animals. Error bars represent the mean ± standard deviation (S.D.), *p<0.005. |