
Fig. 4
- ID
- ZDB-FIG-140922-15
- Publication
- Sasaki et al., 2014 - Aberrant Autolysosomal Regulation Is Linked to The Induction of Embryonic Senescence: Differential Roles of Beclin 1 and p53 in Vertebrate Spns1 Deficiency
- Other Figures
- All Figure Page
- Back to All Figure Page
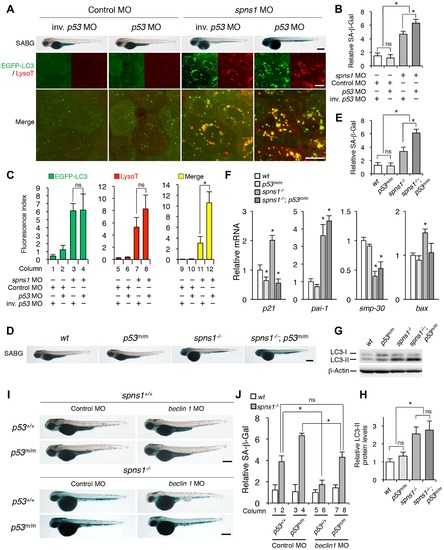
p53 depletion does not suppress but rather exacerbates Spns1 deficiency. (A) Effect of p53 knockdown on embryonic senescence and autolysosome formation in spns1 morphants. The impact of transient p53 knockdown on SA-β-gal (SABG) induction, as well as on EGFP-LC3 and LysoTracker (LysoT) puncta, was determined in spns1 morphants at 84 hpf, followed by the MO (4 ng/embryo) injections. Inverse-sequence p53 MO (inv. p53 MO) was used as a negative control for the original p53 MO. Scale bar, 250 μm in the SABG images. Scale bar, 10 μm in the fluorescence images. (B) Quantification of the SA-β-gal intensities in MO-injected animals, as shown for the SABG images in (A). Quantification of data presented in the top row (SABG) in B (n = 12) is shown; the number (n) of animals is for each morphant. (C) Quantification of EGFP-LC3 and LysoTracker puncta in MO-injected animals shown in (A) (n = 9); the number (n) of animals is for each morphant. Three independent areas (periderm or basal epidermal cells above the eye) were selected from individual animals. (D) Effect of a p53 mutation on embryonic SA-β-gal activity in the spns1 mutant. The heritable impact of p53 and Spns1 on SA-β-gal induction was tested in each single gene mutant [spns1hi891/hi891 (spns1-/-) or tp53zdf1/zdf1 (p53m/m)] and double mutant spns1hi891/hi891;tp53zdf1/zdf1 (spns1-/-;p53m/m) compared with wild-type (wt) animals at 84 hpf. Scale bar, 250 μm. (E) Quantification of the SA-β-gal intensities in wt, tp53zdf1/zdf1, spns1hi891/hi891 and spns1hi891/hi891;tp53zdf1/zdf1 animals, shown in (D). Quantification of data presented in panel D (n = 12) is shown; the number (n) of animals is for each genotype. (F) Quantitative RT-PCR analyses of senescence marker and/or mediator expression as well as p53-downstream target genes in wt, tp53zdf1/zdf1, spns1hi891/hi891 and spns1hi891/hi891;tp53zdf1/zdf1 at 72 hpf. Data are mean ±SD [n = 4 samples (3 embryos/sample) per genotype]. Asterisks denote significant changes compared to wt values. *p<0.05. (G) LC3 conversions in p53 and spns1-mutant animals. Protein detection for the conversion/accumulation of LC3-I to LC-II was performed in the described mutant background animals in comparison with wt fish at 84 hpf. Western blot analysis using anti-LC3 antibody shows endogenous LC3 protein levels, which can confirm an increase of the total amount of LC3 in the p53 mutant compared with wt fish. Increased LC3-II conversion/accumulation was detected in p53 and spns1 double-mutants as well as in spns1 single-mutant fish. (H) The blotting band intensities of LC3-I, LC3-II and β-actin were quantified (n = 6), and the relative ratios between LC3-II/actin and LC3-I/actin are shown in the bar graph; the number (n) of animals is for each genotype. (I) wt, tp53zdf1/zdf1, spns1hi891/hi891 and spns1hi891/hi891;tp53zdf1/zdf1 embryos injected with beclin 1 MO or control MO (12 ng/embryo) were assayed for SA-β-gal at 84 hpf. beclin 1 MO-mediated suppression of SA-β-gal in spns1hi891/hi891 animals was attenuated in the p53 mutant background. Scale bar, 250 μm. (J) Quantification of the SA-β-gal intensities shown in (I). Quantification of data presented in H (n = 12) is shown; the number (n) of animals is for each genotype with MO. Error bars represent the mean ± S.D., *p<0.005; ns, not significant. |
| Gene: | |
|---|---|
| Fish: | |
| Knockdown Reagents: | |
| Anatomical Terms: | |
| Stage: | Protruding-mouth |
| Fish: | |
|---|---|
| Knockdown Reagents: | |
| Observed In: | |
| Stage: | Protruding-mouth |