
FIGURE
Fig. S3
- ID
- ZDB-FIG-140908-10
- Publication
- Benato et al., 2014 - A living biosensor model to dynamically trace glucocorticoid transcriptional activity during development and adult life in zebrafish
- Other Figures
- All Figure Page
- Back to All Figure Page
Fig. S3
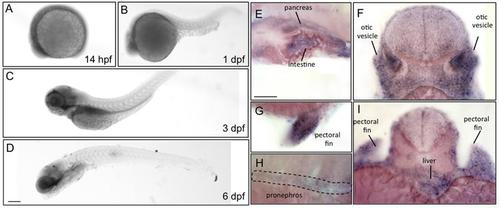
A-D) Light microscopy lateral views of zebrafish embryos and larvae at 14 hpf and 1, 3 and 6 dpf displaying gr mRNA localization during development. E-I) Details of gr positive structures of 2 dpf larvae embryos analysed by WMISH. Scale bar: 200 µM. |
Expression Data
| Gene: | |
|---|---|
| Fish: | |
| Anatomical Terms: | |
| Stage Range: | 10-13 somites to Day 6 |
Expression Detail
Antibody Labeling
Phenotype Data
Phenotype Detail
Acknowledgments
This image is the copyrighted work of the attributed author or publisher, and
ZFIN has permission only to display this image to its users.
Additional permissions should be obtained from the applicable author or publisher of the image.
Reprinted from Molecular and Cellular Endocrinology, 392(1-2), Benato, F., Colletti, E., Skobo, T., Moro, E., Colombo, L., Argenton, F., Dalla Valle, L., A living biosensor model to dynamically trace glucocorticoid transcriptional activity during development and adult life in zebrafish, 60-72, Copyright (2014) with permission from Elsevier. Full text @ Mol. Cell. Endocrinol.