
Fig. 3
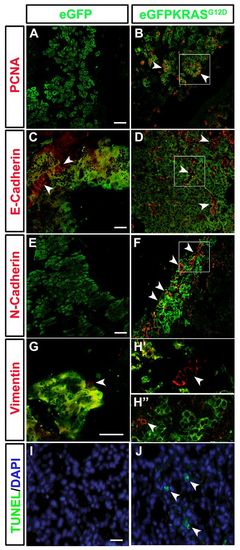
Cell hyperproliferation, EMT and apoptosis induction during pancreatic cancer. Markers of EMT (E-Cadherin, N-Cadherin and Vimentin), cell proliferation (PCNA) and apoptosis were assessed by immunohistochemistry on pancreatic tissue of both control Tg(ptf1a:eGFP) and tumor-prone Tg(ptf1a:Gal4)/UAS:eGFP-KRASG12D lines. (A,B) The cell proliferation marker PCNA (white arrowheads) is increased in tumor-prone fish (B) compared with controls (A). Cropped image evidenced by white square is reported in supplementary material Fig. S3B2. (C,D) No differences in E-Cadherin (white arrowheads) expression was shown between pancreas of tumor-prone fish (D) compared with controls (C). Cropped image evidenced by white square is reported in supplementary material Fig. S3D2. (E,F) N-Cadherin (white arrowheads) is highly expressed in Tg(ptf1a:Gal4)/UAS:eGFP-KRASG12D fish (F) whereas it is almost absent in controls (E). Cropped image evidenced by white square is reported in supplementary material Fig. S3F2. (G–H3) A slight increase in Vimentin expression (white arrowheads) was seen in both tumor mass and stroma of Tg(ptf1a:Gal4)/UAS:eGFP-KRASG12D fish (H2,H3) whereas it resulted low expressed in controls (G). Apoptosis level was higher in tumor-prone fish (J) than in controls (I) as indicated by white arrowheads in J. Analyses were performed on 7 tumor and 7 control samples. All samples were analyzed at 3 mpf. Scale bars: 100 μm. |