
Fig. 2
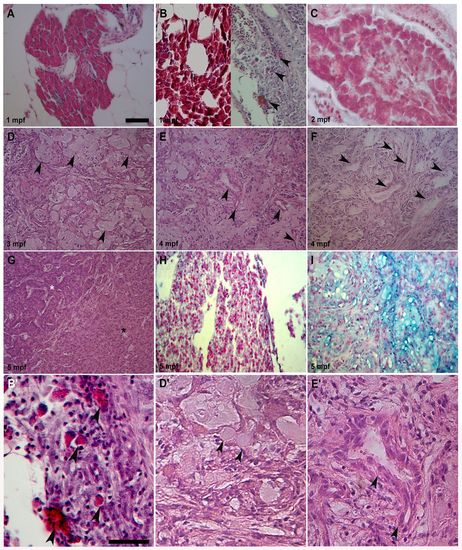
Different pancreas transformations induced by KRASG12D. (A) Control exocrine pancreas characterized by organized acinar clusters surrounded by fat cells and ducts. (B, left; C). Pre-tumoral acinar hyperplasia induced by KRASG12D seen in 6 out of 16 analyzed samples at 1 and 2 mpf. Acinar tissue extension over the entire exocrine pancreas replaced the ductal ephitelium. (B, right) Pre-tumoral fibrotic pancreas tissue with stromal enrichment, reactive ducts and a few acinar cells (arrowheads) interspersed inside disorganized exocrine tissue was seen in 10 out of 16 collected samples. (D) End-stage mucinous pancreatic adenocarcinoma of acinar origin with goblet cells (arrowheads) interspersed into exocrine tissue. (E) End-stage mucinous pancreatic adenocarcinoma with reactive ducts (arrowheads), increasing stroma and goblet cells. (F) End-stage mucinous adenocarcinoma with reactive ducts losing their morphology (arrowheads), stromal enrichment and disorganization of acinar tissue. (G) End-stage pancreatic adenocarcinoma with mixed acinar/ductal features showing an expansion of acinar tissue (black asterisk), its disorganization and duct hyperactivity (white asterisk). (H) Control exocrine pancreas Alcian Blue-negative samples showing organized acinar and duct structure. (I) End-stage mucinous Alcian Blue-positive pancreatic adenocarcinoma with goblet cells and small duct-like structures interspersed in a disorganized acinar tissue. Tumors shown in D, E, F and I were seen in 7 out of 15 analyzed samples between 3 and 5 mpf. Tumor shown in G was seen in 8 out of 15 analyzed samples between 3 and 5 mpf. (B2,D2,E2) More detailed magnifications of B (right), D and E. Arrowheads indicate acinar cells in B2, goblet cells in D2 and duct-like structures in E2. Age of analyzed samples is indicated. Scale bars: 50 μm. |