
FIGURE
Fig. 4
- ID
- ZDB-FIG-140812-21
- Publication
- Wiweger et al., 2014 - Possible effects of EXT2 on mesenchymal differentiation--lessons from the zebrafish
- Other Figures
- All Figure Page
- Back to All Figure Page
Fig. 4
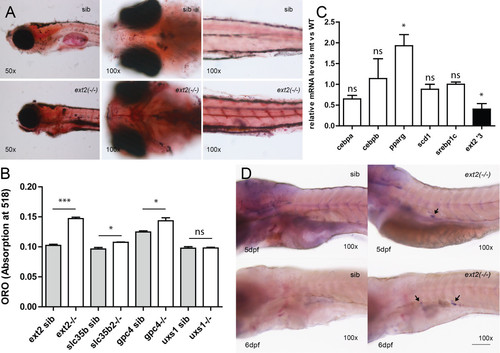
Increased lipid levels in the ext2-/-fish coincide with decreased bone formation. A, Oil red O stain (ORO) in fish at 6dpf; B, the levels of lipids represented as absorbance of bounded ORO in 6 days old proteoglycan mutants: ext2, slc35b2, gpc4 and uxs1 (for more description see Additional file 2); C, the level of transcripts in 5-days old fish determined by quantitative PCR and normalised to slc25a5 level. Primer sequences are given in Table 1; D, whole mount fabp11a mRNA in situ hybridisation showing prematurely developing adipocytes in the belly of the ext2-/- fish. Error bars represent means with SEM. |
Expression Data
| Gene: | |
|---|---|
| Fish: | |
| Anatomical Term: | |
| Stage Range: | Day 5 to Day 6 |
Expression Detail
Antibody Labeling
Phenotype Data
| Fish: | |
|---|---|
| Observed In: | |
| Stage Range: | Day 5 to Day 6 |
Phenotype Detail
Acknowledgments
This image is the copyrighted work of the attributed author or publisher, and
ZFIN has permission only to display this image to its users.
Additional permissions should be obtained from the applicable author or publisher of the image.
Full text @ Orphanet J Rare Dis