
Fig. 5
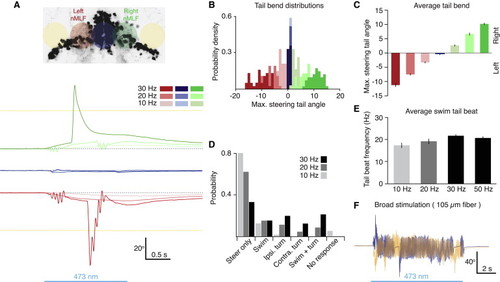
Behavioral Effects of ChR2 Stimulation Depend on Light Dose and Fiber Location (A) Top: schematic of five stimulation sites within the midbrain expression pattern of Gal4s1171t. Bottom: traces depict tail angle as a function of time in a single fish at five stimulus locations with 10 Hz, 20 Hz, and 30 Hz light pulses (10 μm fiber diameter, 10 ms pulse duration, 1 mW/mm2). Blue line depicts the epoch of ChR2 stimulation. (B) Probability density histogram for maximum tail angles at left, middle and right stimulation sites (n ≥ 30 for left and right positions, n ≥ 20 middle). Color code is the same as in (A). (C) Mean values for maximum tail angle at left, middle and right stimulation locations (effect of frequency and location: p < 0.01). Color code is the same as in (A). (D) Probability of observing different tail kinematics at each stimulation frequency. Left and right trials were combined. (E) Tail beat frequencies for swim bouts at each stimulation frequency (effect of frequency: p < 0.05; n ≥ 9). (F) Two trials (blue and yellow) where long swimming bouts were evoked by bilateral stimulation with a large (105 μm) optic fiber (n = 2; 20 Hz pulse frequency). n values indicate number of fish. Error bars indicate SEM. See also Figure S6. |