
Fig. S3
- ID
- ZDB-FIG-140624-33
- Publication
- Zeng et al., 2014 - Cadm4 Restricts the Production of Cardiac Outflow Tract Progenitor Cells
- Other Figures
- All Figure Page
- Back to All Figure Page
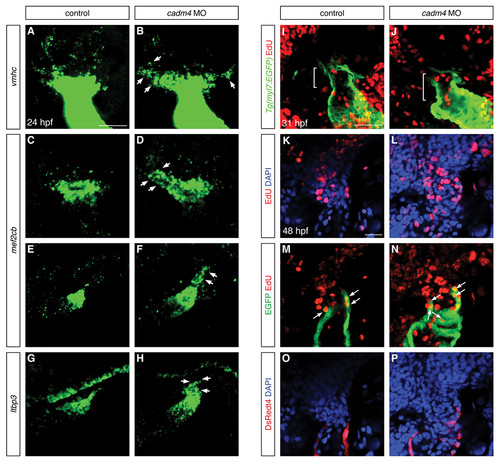
Cadm4 limits production of OFT progenitor cells but does not affect proliferation of OFT CMs. (A-D) In situ hybridization depicts expression of vmhc (A,B) and mef2cb (C,D) at 24 hpf; partial reconstructions of dorsal views, arterial pole up. In comparison to control embryos (A,C), cadm4 morphants exhibit expansion of the population of presumed OFT progenitor cells (B,D, arrows). (E-H) In situ hybridization depicts expression of mef2cb (E,F) and ltbp3 (G,H) at 24 hpf; partial reconstructions of lateral views, arterial pole up. Relative to control embryos (E,G), cadm4 morphants display expanded expression (arrows) of mef2cb (F) and ltbp3 (H) adjacent to the arterial pole. (I,J) EdU incorporation (red) in embryos expressing Tg(myl7:EGFP) (green) at 31 hpf, following EdU addition at 28 hpf; single confocal slices of dorsal views. No EdU incorporation was detected in CMs within the OFT (brackets) in control embryos (I; n=5). In cadm4 morphant embryos (J; n=6), EdU incorporation was detected in one OFT CM in one of the six embryos examined. In parallel experiments, we examined EdU incorporation in proximal OFT progenitor cells expressing low levels of Tg(myl7:EGFP) at 31 hpf, following EdU addition at 28 hpf; we found no significant difference in the proliferation index for this population between control embryos (17.6%+3.0%; n=3) and cadm4 morphants (14.3%+1.8%; n=4). (K-P) Single confocal slices of frontal views of Tg(myl7:EGFP);Tg(myl7:DsRedt4) hearts at 48 hpf, following EdU addition at 24 hpf. (K,L) EdU incorporation (red) is visible in DAPI-stained nuclei (blue). (M,N) EdU incorporation (red) is seen in some Tg(myl7:EGFP)-expressing CMs (green); arrows indicate the EdU-positive late differentiating CMs that do not express Tg(myl7:DsRedt4). (O,P) Expression of Tg(myl7:DsRedt4) (red) distinguishes early-differentiating and late-differentiating subsets of CMs, as in Fig. 2J-R. Control embryos (K,M,O) displayed EdU incorporation in 4±1 late-differentiating cells (n=10), whereas cadm4 morphant embryos displayed EdU incorporation in 8±2 late-differentiating cells (n=6). Thus, the number of proliferating OFT CMs appears proportional to the total number of OFT CMs in both cadm4 morphants and control siblings (Fig. 2I). Scale bars: 50 μm. |
| Genes: | |
|---|---|
| Fish: | |
| Knockdown Reagent: | |
| Anatomical Terms: | |
| Stage Range: | Prim-5 to Long-pec |