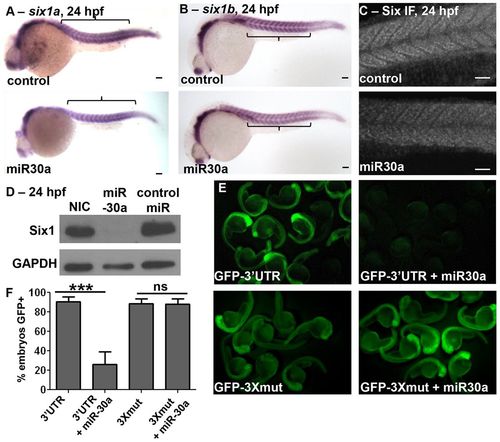
miR30a overexpression directly downregulates Six1 expression. miR30a overexpression results in (A) no substantial decreases in six1a mRNA (control, n = 25/28; miR30a, n = 31/43) and (B) no substantial decreases in six1b mRNA (control, n = 20/23; miR30a, n = 22/28) levels as visualized by in situ hybridization, (C) downregulated SIX family protein expression in the somites as observed in immunofluorescence images (control, n = 8/9; miR30a, n = 12/20), and (D) decreased Six1 protein levels as determined by western blot analysis, all at 24hpf. NIC, non-injected control. Anterior is shown to the left. (E) GFP expression at 24 hpf, imaged at low magnification in multiple embryos, is observed after injection of GFP–six1a-32UTR (GFP–32UTR) mRNA, and this GFP expression is lost when co-injected with miR30a duplex. However, GFP expression remains after co-injection of miR30a with a GFP–six1a-32UTR mRNA that has all three miR30a target seed sites mutated (GFP–3Xmut). (F) The percentage of embryos expressing GFP is quantified (mean±s.e.m.) in embryos expressing GFP–32UTR (n = 79 total embryos), GFP–32UTR + miR30a (n = 37), GFP–3Xmut (n = 90) or GFP–3Xmut (94). ***P = 0.0003, ANOVA with Bonferroni′s post-hoc test; ns, not significant. Scale bars: 50µm. For A–C, n = the number of embryos represented by each image/the total number of embryos analyzed.
|
