
FIGURE
Fig. 4
- ID
- ZDB-FIG-140617-17
- Publication
- Flasse et al., 2013 - Ascl1b and Neurod1, instead of Neurog3, control pancreatic endocrine cell fate in zebrafish
- Other Figures
- All Figure Page
- Back to All Figure Page
Fig. 4
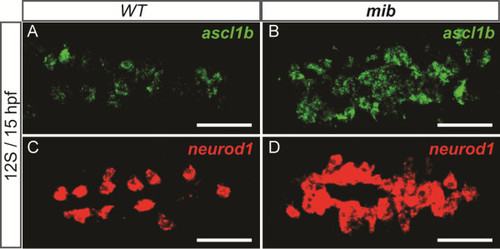
Pancreatic expression of ascl1b and neurod1 is repressed by Notch signaling. Fluorescent WISH showing pancreatic expression of ascl1b(A-B) and neurod1(C-D) in wild-type (wt) embryos (A, C) and mind bomb (mib) mutants (B, D). Confocal projection images. All views are ventral views of 15 hpf embryos with anterior part to the left. Scale bars : 50 µm hpf, hours post fertilization; WISH, whole-mount in situ hybridization. |
Expression Data
| Genes: | |
|---|---|
| Fish: | |
| Anatomical Term: | |
| Stage: | 10-13 somites |
Expression Detail
Antibody Labeling
Phenotype Data
Phenotype Detail
Acknowledgments
This image is the copyrighted work of the attributed author or publisher, and
ZFIN has permission only to display this image to its users.
Additional permissions should be obtained from the applicable author or publisher of the image.
Full text @ BMC Biol.