
FIGURE
Fig. S3
Fig. S3
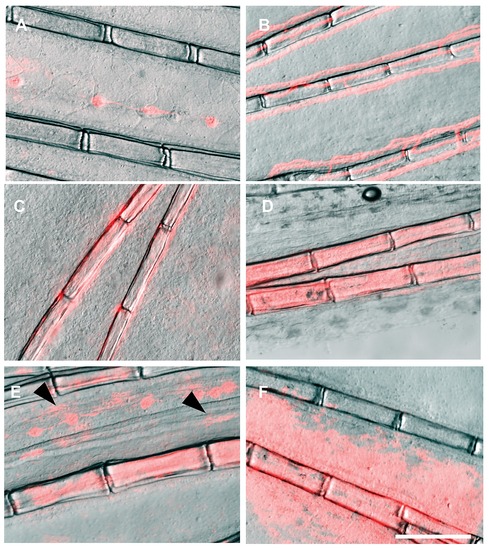
The control plasmid ef1a:DsRed drives DsRed expression in a wide range of cell types and tissues within the fin. (A) lateral line, (B) vasculature, (C) osteoblasts, (D) fibroblasts, (E) pigment cells (arrows), showing the typical stellated shape, and (F) epidermis. Scale bar: 200 μm |
Expression Data
Expression Detail
Antibody Labeling
Phenotype Data
Phenotype Detail
Acknowledgments
This image is the copyrighted work of the attributed author or publisher, and
ZFIN has permission only to display this image to its users.
Additional permissions should be obtained from the applicable author or publisher of the image.
Full text @ PLoS Genet.