
Fig. 4
- ID
- ZDB-FIG-140421-5
- Publication
- Koch et al., 2014 - Spatial and temporal expression patterns of chitinase genes in developing zebrafish embryos
- Other Figures
- All Figure Page
- Back to All Figure Page
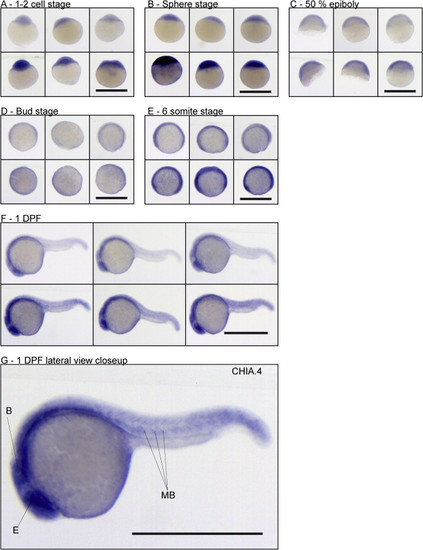
CHIA gene expression from zygote to segmentation. (A–F) In situ hybridization results for the six earliest stages. In each panel the order is the same, top left: CHIA.1; top centre: CHIA.2; top right: CHIA.3; bottom left: CHIA.4; bottom centre: CHIA.5; bottom right: CHIA.6. The bar represents 1 mm in each case. (A–E) No differential pattern of gene expression can be distinguished in any of the initial stages of development. The early peak in CHIA.4 expression ( Fig. 3B) can be clearly seen in panels A and B. After sphere stage, all CHIA appear ubiquituously and lowly expressed (C–E). At 24 HPF the first distinguishable patterns can be seen (F). (G) Scale-up picture of the CHIA.4 ISH result, representative for patterns visible in all ISHs: the signal is concentrated in the developing eye (E) and brain (B), as well as at the myotome borders (MB). |
| Genes: | |
|---|---|
| Fish: | |
| Anatomical Terms: | |
| Stage Range: | 1-cell to Prim-5 |
Reprinted from Gene expression patterns : GEP, 14(2), Koch, B.E., Stougaard, J., and Spaink, H.P., Spatial and temporal expression patterns of chitinase genes in developing zebrafish embryos, 69-77, Copyright (2014) with permission from Elsevier. Full text @ Gene Expr. Patterns