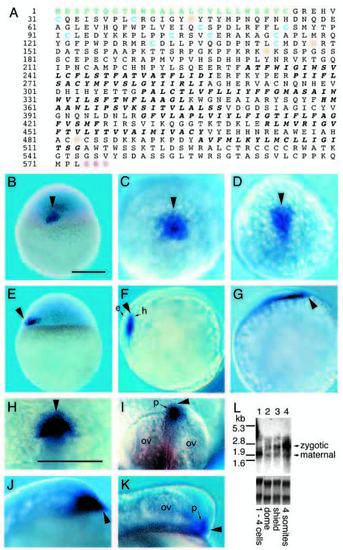
Zebrafish frizzled A (fzA) protein and expression during day one of development. (A) Deduced zebrafish fzA protein sequence. The amino-terminal signaling sequence is in green, conservative cysteines are blue, and the putative PDZ binding motif is in red. Consensus N-linked glycosylation sites are indicated by orange, and the putative transmembrane domains are printed in bold italics. (BL) fzA distribution as determined using whole mount in situ hybridization. In each pairwise view of the same embryo, the arrowhead denotes dorsal or, in later embryos, anterior end of developing embryo as marked by fzA expression. (B,E) fzA localized just after the onset of zygotic transcription (sphere stage) to cells near yolk and animal cap boundary; lateral views with the animal pole to top. (C,F) By early gastrulation (shield stage), fzA is detected in the dorsal mesendoderm. e indicates epiblast and h indicates hypoblast. C is a dorsal and F a lateral view. (D,G) By the end of gastrulation, fzA expression is concentrated in the anterior part of the developing embryo. D is a rostral-dorsal view, G is a lateral view. (H,J) In mid-somitogenesis embryos, fzA is localized to rostral regions. H is a rostral-dorsal view with anterior to the top, J is a lateral view with anterior to the right. (I,K) During late somitogenesis fzA is localized to anterior ectoderm. p indicates protuberance and ov indicates optic vesicles. I is a rostral-dorsal view with anterior to the top, K a lateral view with anterior to the right. (L) Northern blot analysis of fzA mRNA expression. rRNA stained with ethidium bromide is shown in the lower panel as a loading control. In the upper panel, hybridization results are shown. Smaller (maternal) band is abundant at 1-4 cell stage and rapidly diminishes later in development. Expression of larger (zygotic) band is detected after zygotic transcription has initiated and continues throughout gastrulation and segmentation stages. Scale bars (B-G) (H-K) 250 μm.
|
