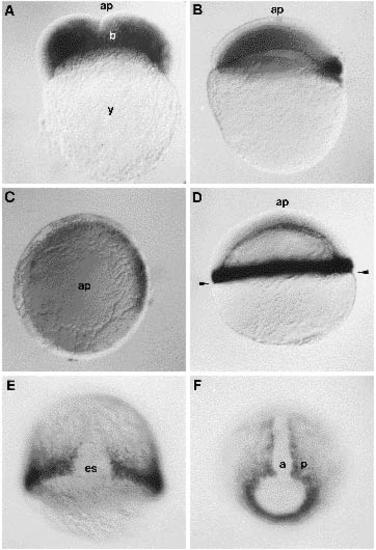
Distribution of snail1 RNA during cleavage, blastula and gastrulation. Transcripts from the snail1 gene were revealed by whole-mount in situ hybridization. Lateral views of embryos are oriented with their animal pole up and dorsal side to the right. Animal pole views also have dorsal sides to the right. (A) 2-cell stage, lateral view. Blastomeres are labelled with snail1 antisense probe. ap, animal pole; b, blastomeres; y, yolk cell. (B) Beginning of dome stage, lateral view. The zygotic expression of snail1 has begun on one side of the embryo. Double labelling with the zebrafish goosecoid RNA shows that this is the future dorsal side of the embryo (our unpublished data). (C) Same stage as B, animal pole view. The zygotic RNA occupies an arc on one side of the embryo. The rest of the embryo is labelled more faintly with maternal RNA. (D) 40% epiboly, lateral view. snail1 RNA is localized all around the margin and maternal RNA has mostly disappeared. The two arrows show the position of the margin. (E) 70% epiboly, dorsal view. snail1 transcript disappears from the central part of the embryonic shield (es). (F) 90% epiboly, posterior or vegetal pole view. snail1 RNA is excluded from the axial mesoderm (a) and restricted to the paraxial mesoderm (p) and marginal region.
|
