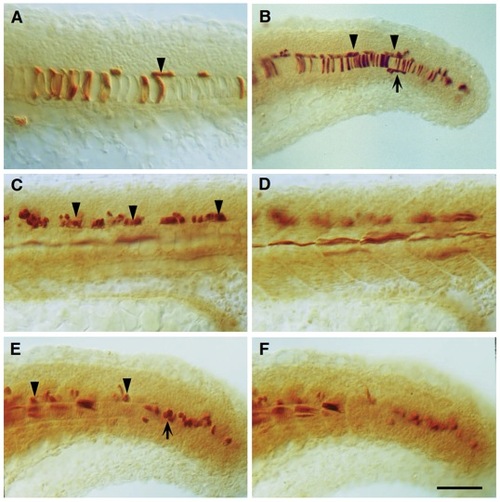
Dorsal axial transplants of flh mutant cells differentiate into floor plate and muscle instead of floor plate and notochord. Sagittal views of 24 hour WT host embryos with (A, B) WT or (C-F) flh mutant donor cells (dark brown) derived from dorsal axial transplants. A transplant was defined as a dorsal axial transplant if donor cells contributed to >20 floor plate cells in the ventral spinal cord of the trunk and tail. (A,B) In the case of control experiments with WT cells, donor cells that gave rise to floor plate (arrowheads), also gave rise to notochord cells (93% of dorsal axial transplants, n=27/29, present study and 95%, n=56/59, Halpern et al., 1993), and sometimes hypochord cells (arrow in B). (C) flh- donor cells contributed to floor plate (arrowheads) but not notochord. (D) Instead, mutant cells formed muscle fibers. A total of 72 blastulas were transplanted. Out of 17 WT embryos receiving flh- cells, 7 had dorsal axial transplants. Of these, mutant donor cells gave rise to more than 50 muscle fibers in 5 embryos and approximately 35 fibers in 1 embryo. Mutant muscle fibers were often found in the middle of the myotome, with respect to the dorsoventral axis, at the position of muscle pioneers (Felsenfeld et al., 1991). Although flh- cells did not contribute to WT hypochord, due to the lower frequency of donor cells forming hypochord in control transplants, more flh genetic mosaics are needed to confirm that flh- cells are unable to form hypochord. (E,F) Mutant donor cells produced muscle fibers in newly formed somites, however, undifferentiated mesodermal cells in more posterior, and hence, developmentally younger, regions were situated in the midline at the level of the WT notochord (arrow). (C,D, and E,F) Different focal planes of the same embryos. Scale bar = 50 μm for A, C, D, E and F; 75 μm for B.
|
