
Fig. 3
- ID
- ZDB-FIG-140219-33
- Publication
- Chen et al., 2013 - zebraflash transgenic lines for in vivo bioluminescence imaging of stem cells and regeneration in adult zebrafish
- Other Figures
- All Figure Page
- Back to All Figure Page
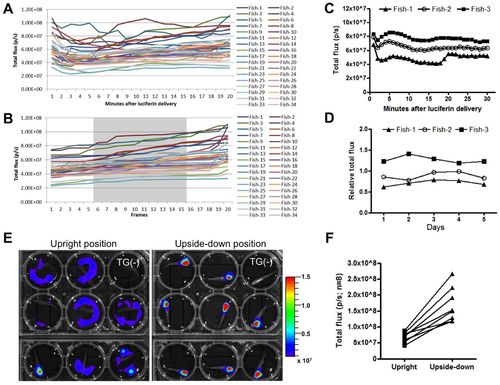
Multiplex imaging of adult zebrafish. (A,B) Bioluminescence recorded during the plateau phase from 34 freely moving adult cmlc2:mCherry-N-2A-Fluc zebrafish over 20 minutes (1 minute/frame ×20) (A). Recorded data were sorted from lowest to highest initial readings. Ten median values from a total of 20 recorded values were averaged (gray areas) and then used for comparison across different animals (B). (C) Representative bioluminescence recorded during the plateau phase from three adult zebrafish after luciferin delivery, indicating that relative signal strength could vary between animals. (D) Relative total flux over 5 days of daily independent measurements, indicating consistency within individual animals. (E) Representative bioluminescence images of animals in either an upright or upside-down position. (Top) Brightfield only; (bottom) brightfield and bioluminescence images overlaid. TG(-), a transgene-negative control animal. Luminescence signals are reported as radiance (p/sec/cm2/sr) with a color bar. (F) Bioluminescence recorded from the same animals in different positions, indicating that the posture of the animals during imaging affects the measured bioluminescence up to 2-fold (n=9). |