
Fig. 2
- ID
- ZDB-FIG-140219-32
- Publication
- Chen et al., 2013 - zebraflash transgenic lines for in vivo bioluminescence imaging of stem cells and regeneration in adult zebrafish
- Other Figures
- All Figure Page
- Back to All Figure Page
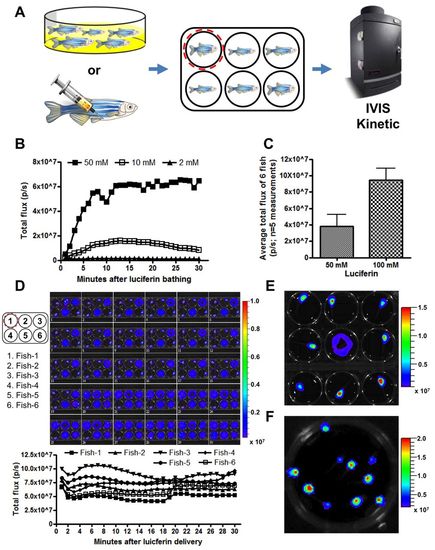
Quantitative luciferase imaging in freely moving adult zebrafish. (A) Scheme of luciferin delivery and imaging. Bioluminescence from the region of interest (ROI; red dashed line) was measured over 20 minutes and expressed as p/sec. (B) Kinetics of bioluminescence recorded immediately after luciferin delivery. Luciferin (2 mM, 10 mM and 50 mM) was delivered to fish by bath incubation. (C) Comparison of average bioluminescence after delivery of 50 mM or 100 mM luciferin. Luciferin was delivered to the same set of fish (n=6) over five rounds of independent measurements (mean ± s.d.). (D) Bioluminescence recorded during the plateau phase from six freely moving fish over 30 minutes (1 minute/frame ×30) after luciferin delivery. (Top) Trace of bioluminescence in multi-well plates indicating the activity level of the animal during imaging. (Bottom) Bioluminescence recorded from Individual animals. (E) Representative bioluminescence images of nine freely moving adult cmlc2:mCherry-N-2A-Fluc animals inside an imaging chamber. (F) Snapshot of a movie of ten swimming 4-week-old juvenile cmlc2:mCherry-N-2A-Fluc animals, indicating cardiac bioluminescence. Luminescence signals are reported as radiance (p/sec/cm2/sr) with a color bar. |