
Fig. 3
- ID
- ZDB-FIG-131220-21
- Publication
- Peralta et al., 2013 - Heartbeat-Driven Pericardiac Fluid Forces Contribute to Epicardium Morphogenesis
- Other Figures
- All Figure Page
- Back to All Figure Page
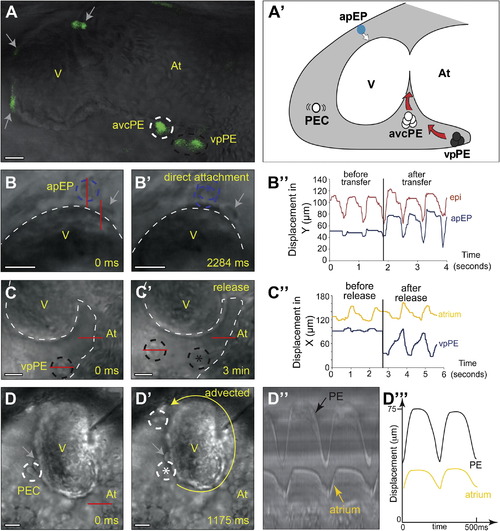
Proepicardial Cells Are Released from Three Distinct Sources (A) Confocal imaging of a 48 hpf Epi:GFP heart showing GFP-positive PE clusters at the atrioventricular canal (avcPE) and venous pole (vpPE) (Movie S3). (A′) Location of the PE cells shown in (A)–(D): advected PE cells (PEC), avcPE cells, vpPE cells, and epicardial progenitors arising from the arterial pole pericardial mesothelium (apEP). The white arrow indicates direct transfer from the pericardial mesothelium to the myocardium; red arrows indicate release into the pericardial cavity (gray shading). (B) apEP cells transfer directly to the myocardium. At the onset of acquisition (0 ms), the apEP cell (blue dotted circle) is attached to the pericardial wall. (B′) Later (2,284 ms), the apEP cell has transfered to the myocardial surface (Movie S4). (B′′) Tracking of an apEP cell. Note the limited movement in response to contact with the ventricle before transfer (blue trace). Red lines mark the regions in which displacement was measured for kymographs. Motion after transfer is comparable to that of an epicardial cell attached at an earlier time point (red trace). (C and C2) A vpPE cluster (black dotted circle) moving in response to heart contraction, which leads to its release (PE cluster reveals a limited motion before release and increased oscillatory motion afterward, coupled to atrial wall contraction. (D and D′) A pair of advected PE cells (PEC white dotted circles) in the cavity circumnavigate the ventricle in the direction denoted by the yellow arrow (Movie S6). (D′′ and D′′′) Kymograph analysis and highlighted representation showing coupling of this motion to atrial contraction. In all kymograph analyses, displacement values enable the synchronization of PE cell motion after attachment to the myocardium or release from the cluster to be seen. In all panels, gray arrows mark epicardial cells on the myocardial surface prior to acquisition and asterisks indicate PE cell positions before release. Scale bars represent 20 μm. See also Movies S3, S4, S5, S6, and S7. |