Epicardium Development Visualized by a Zebrafish Reporter Line and by Electron Microscopy, Related to Figure 1
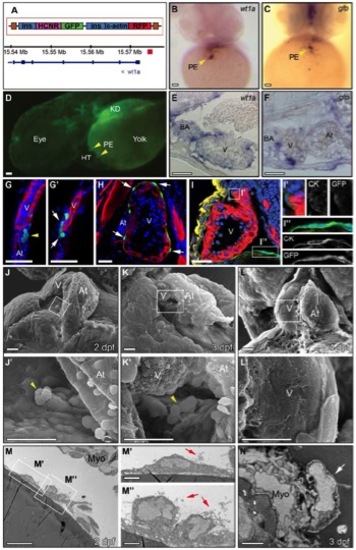
(A) Generation of the Et(-26.5Hsa.WT1-gata2:EGFP)cn1 enhancer trap line. A 500 bp region upstream of human Wilm′s tumour gene (WT1) was cloned into the ZED vector [1], containing a cassette driving RFP expression under the control of cardiac actin and GFP from a minimal Gata2 promoter. One founder line was obtained in which the plasmid was inserted 4 kb upstream of the wilms tumor 1 a (wt1a) transcription initiation site (Red box). (B-C) wt1a and gfp whole-mount mRNA in situ hybridization (ISH) in larvae at 2 dpf. Frontal views reveal staining of the proepicardium (PE). (D) Fluorescent image of a laterally positioned Et(- 26.5Hsa.WT1-gata2:EGFP)cn1 larva revealing GFP expression in two PE clusters at the atrioventricular canal and venous pole and the kidney anlage (KD). (E-F) ISH on sections showing gfp- and wt1a-positive cells on the myocardial surface. (G-H) Sections of whole mount immunostained hearts shown in Figure 1B and 1C showing GFP-positive PE and epicardial cells on the myocardial surface at 3 dpf (GG′) and 6 dpf (H). (I-I′′) Immunohistochemistry on heart sections at 65 hpf. Epicardial and pericardial cells expressing GFP (green) co-express cytokeratin (CK, yellow). Anti-myosin heavy chain (MHC) is shown in red, cell nuclei are marked with DAPI (blue). (J-L′) Scanning electron microscopy images showing ventral views of hearts at 2, 3 and 4 dpf. Anterior is to the top. J′-L′ show zoomed views of boxed areas in J-L. J′ and K′ show clusters of about 6 cells on the dorsal pericardial wall positioned at the level of the AVC, which are not in direct contact with the myocardium. At 4 dpf, the myocardial wall was covered by a layer of flattened epicardial cells (L,L′). (M-N) Transmission electron microscopy images of sagittal sections through hearts of larvae at 2 (M-M′′) and 3 dpf (N). M′ and M′′ show zoomed views of boxed areas in M. Pericardial mesothelial cells revealed a flattened morphology with little extracellular matrix (M′); in contrast, the cells of the nascent PE cluster were rounded and showed more extracellular matrix deposition on their apical surface (M′′, red arrows). Black arrow in N marks an epicardial cell attached to the myocardium. In all panels, yellow arrowheads mark the PE and white arrows epicardial cells. Scale bars (B-D and M) 10 μm, (E-I) 40 μm, (J-L′) 20 μm and (M′-N) 2 μm. At, atrium; BA, bulbus arteriosus; c-actin; cardiac actin; Epi, epicardium; GFP, green fluorescent protein; HCNR, highly conserved non-coding region; HT, heart tube; ins, insulator; KD, kidney; Myo, myocardium; RFP, red fluorescent protein; PE, proepicardium; V, ventricle.
|
