
FIGURE
Fig. 3
Fig. 3
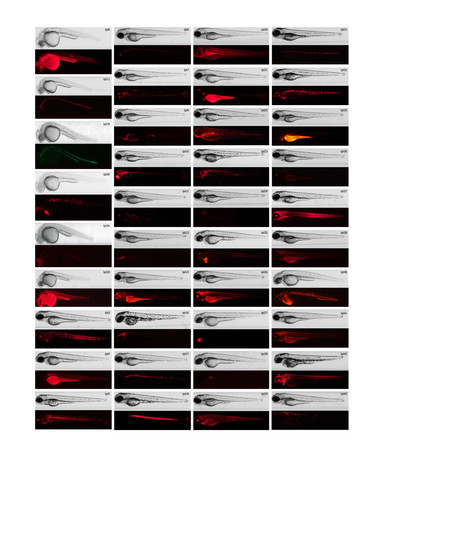
Expression patterns recovered from the gene trap screen. Each gene trap line is represented by two images: brightfield and fluorescence. Most of the lines are represented by expression pattern of the fluorescent reporter observed in 3dpf embryos, except for those lines were reporter’s expression pattern is best visible in embryos at earlier stages of development. The latter include lines tpl8, tpl11, tpl19, tpl30, tpl34 and tpl39 for which embryos were imaged at 1 dpf, as well as lines tpl4, tpl6, tpl16, tpl21, tpl22, tpl25, tpl27, tpl28, tpl40 and tpl42 that are represented by 2 dpf embryos. |
Expression Data
Expression Detail
Antibody Labeling
Phenotype Data
Phenotype Detail
Acknowledgments
This image is the copyrighted work of the attributed author or publisher, and
ZFIN has permission only to display this image to its users.
Additional permissions should be obtained from the applicable author or publisher of the image.
Full text @ BMC Genomics