
|
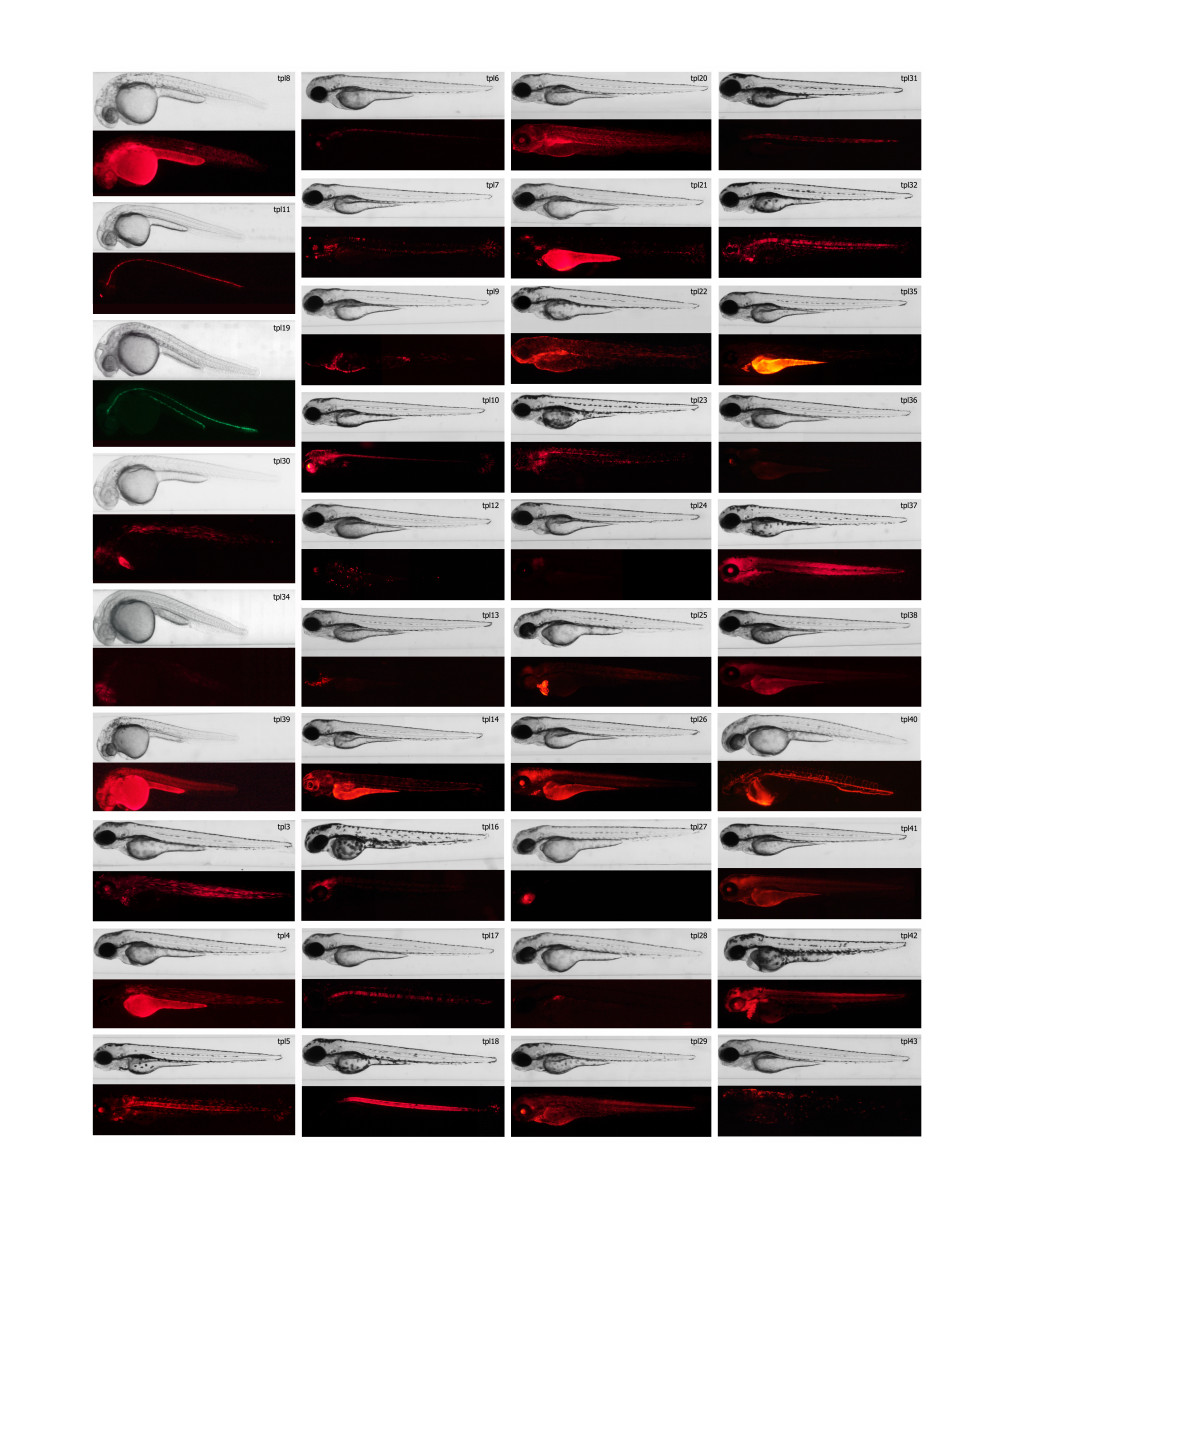
Fig. 3 Expression patterns recovered from the gene trap screen. Each gene trap line is represented by two images: brightfield and fluorescence. Most of the lines are represented by expression pattern of the fluorescent reporter observed in 3dpf embryos, except for those lines were reporter’s expression pattern is best visible in embryos at earlier stages of development. The latter include lines tpl8, tpl11, tpl19, tpl30, tpl34 and tpl39 for which embryos were imaged at 1 dpf, as well as lines tpl4, tpl6, tpl16, tpl21, tpl22, tpl25, tpl27, tpl28, tpl40 and tpl42 that are represented by 2 dpf embryos.