
Fig. 6
- ID
- ZDB-FIG-131025-11
- Publication
- Lin et al., 2013 - MicroRNA-3906 Regulates Fast Muscle Differentiation through Modulating the Target Gene homer-1b in Zebrafish Embryos
- Other Figures
- All Figure Page
- Back to All Figure Page
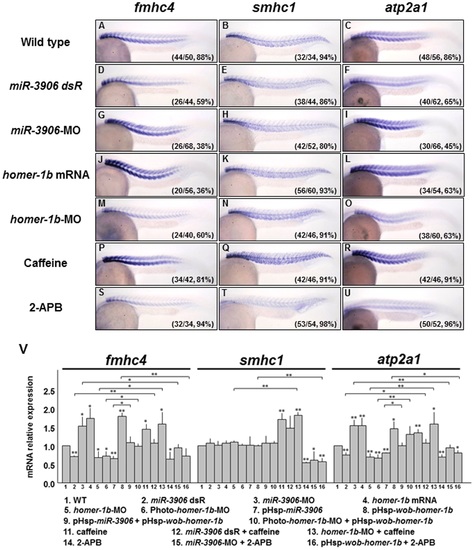
Injection of either miR-3906-MO or homer-1b mRNA affects fast muscle differentiation by regulating the calcium concentration in muscle cells. (A-C) Wild-type (WT) zebrafish embryos at 24 hpf and embryos injected with (D-F) miR-3906 dsR (1.5 ng), (G-I) miR-3906-MO (8 ng), (J-L) homer-1b mRNA (400 pg), and (M-O) homer-1b-MO (3 ng) were collected, and the expressions of fast muscle type fmhc4, slow muscle type smhc1, and calcium-sensitive gene atp2a1 were detected by WISH. (P-R) Embryos soaked with caffeine served as a positive control, indicating that [Ca2+]i was increased. (S-U) Embryos soaked with 2-APB served as a negative control, indicating that [Ca2+]i was reduced. Compared to WT (A), the expression of fmhc4 in the embryos injected with miR-3906-MO (G), homer-1b-mRNA (J) and soaked in caffeine (P) was increased. The expression of fmhc4 in the embryos injected with miR-3906 dsR (D), homer-1b-MO (M) and soaked in 2-APB (S) was decreased. The expressions of smhc1 in the embryos injected with miR-3906 and homer-1b showed no difference (B, E, H and K), while smhc1 expression was increased in embryos soaked in caffeine (Q) and reduced in embryos soaked in 2-APB (T). The expression patterns of atp2a1 (F, I, L, O, R and U) in the examined embryos displayed a result similar to that of fmhc4. (V) The expression levels of the examined genes were quantified by q-PCR analysis after embryos were treated as indicated. Three rescue experiments were included: co-injection of pHsp-wob-homer-1b (lanes 9 and 10), soaking with caffeine (lanes 12 and 13) and incubating with 2-APB (lanes 15 and 16). SigmaPlot software was used to perform the Student’s t-test. *: indicates the difference at P<0.05 level; **: indicates the difference at P<0.01 level. The numbers shown in the lower-right corner of panels A-U indicate the number of phenotypes out of the total number of embryos examined. |
| Genes: | |
|---|---|
| Fish: | |
| Knockdown Reagents: | |
| Anatomical Terms: | |
| Stage: | Prim-5 |