
Fig. 5
- ID
- ZDB-FIG-131025-10
- Publication
- Lin et al., 2013 - MicroRNA-3906 Regulates Fast Muscle Differentiation through Modulating the Target Gene homer-1b in Zebrafish Embryos
- Other Figures
- All Figure Page
- Back to All Figure Page
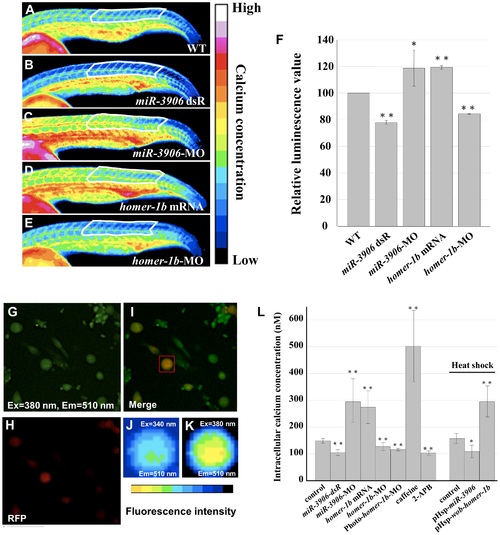
Injection of either homer1b-mRNA or miR-3906-MO increases the calcium concentration within muscle cells. (A) One-cell embryos were injected with buffer (A, as a control group WT), (B) miR-3906 dsR (1.15 ng), (C) miR-3906-MO (8 ng), (D) homer-1b mRNA (400 pg) or (E) homer-1b-MO (3 ng) with calcium green-1 and tetramethylrhodamine (as an internal control). The gradient distribution of Ca2+ concentration within the muscle cells in somites was analyzed at 24 hpf by ImageJ software analysis. There were 16 colors of signal images displaying the different intracellular Ca2+ concentrations from low to high. We sketched a fixed region comprised of 11 to 20 trunk somites, as indicated, to calculate the readings from excitation emission (the region was indicated by white line). (F) After normalization, the reading from the WT group was set as 100, and the readings of miR-3906 dsR-injected, miR-3906-MO-injected, homer-1b-mRNA-injected and homer-1b-MO-injected groups were compared. (G) The primary culture cells were stained with Fura2-AM, excited with 380 nm light, with emission at 510 nm. (H) The primary culture cells which displayed red fluorescence were the fast muscle cells. (I) The merge picture of F and G. Cells which had overlapping signals denoted in yellow were selected as detection samples (indicated by red box). (J) The image of fluorescence intensity shown on fast muscle cells that were excited by 340 nm, with emission at 510 nm. (K) The image of fluorescence intensity shown on fast muscle cells that were excited by 380 nm, with emission at 510 nm. (L) The value of [Ca2+]i was calculated by following the formula established by Grynkiewicz et al. [31] (see Materials and Methods). The values of [Ca2+]i were obtained from cells derived from WT, miR-3906 dsR-injected, miR-3906-MO-injected, homer-1b-mRNA-injected, homer-1b-MO-injected, Photo-homer-1b-MO-injected, caffeine-soaked and 2-APB-soaked embryos, followed by heat-shocked WT, pHsp-miR-3906-injected and pHsp-wob-homer-1b-injected embryos. SigmaPlot software was used to perform Student’s t-test. *: indicates the difference at P<0.05 level; **: indicates the difference at P<0.01 level. Ex: excitation; Em: emission. |
| Fish: | |
|---|---|
| Knockdown Reagents: | |
| Observed In: | |
| Stage: | Prim-5 |