
FIGURE
Fig. S1
- ID
- ZDB-FIG-131010-11
- Publication
- D'Aniello et al., 2013 - Depletion of Retinoic Acid Receptors Initiates a Novel Positive Feedback Mechanism that Promotes Teratogenic Increases in Retinoic Acid
- Other Figures
- All Figure Page
- Back to All Figure Page
Fig. S1
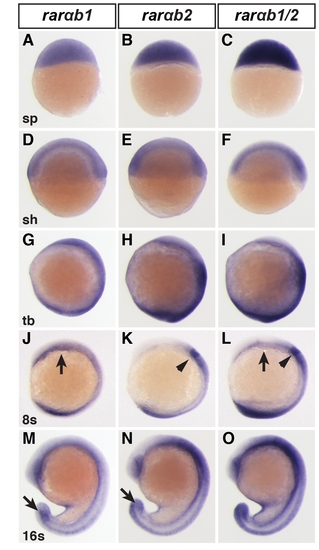
Comparison of RARαb1 and RARαb2 expression. (A, D, G, J, M) rarαb1 expression. (B, E, H, K, N) rarαb2 expression. (C, F, I, L, O) rarαb1/2 is a probe that recognizes both isoforms 24. Arrows in J and L indicate anterior ventral expression. Arrowheads in K and L indicate hindbrain and anterior spinal cord expression. Arrows in M and N indicate differences in the expression of the developing tail. In A-O, all views are lateral. In D-O, dorsal is to the right. |
Expression Data
Expression Detail
Antibody Labeling
Phenotype Data
Phenotype Detail
Acknowledgments
This image is the copyrighted work of the attributed author or publisher, and
ZFIN has permission only to display this image to its users.
Additional permissions should be obtained from the applicable author or publisher of the image.
Full text @ PLoS Genet.