
Fig. 3
- ID
- ZDB-FIG-130906-41
- Publication
- Esposti et al., 2013 - Olfactory Stimulation Selectively Modulates the OFF Pathway in the Retina of Zebrafish
- Other Figures
- All Figure Page
- Back to All Figure Page
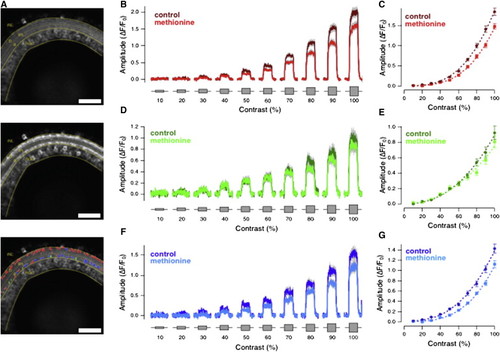
Olfactory Stimulation Reduces Synaptic Responses to Variations in Temporal Contrast in OFF and ON-OFF Retinal Ganglion Cell Dendrites (A) Example of a eno2::GCaMP3.5 fish retina, recorded in vivo, at rest (top), and during contrast stimulation (middle). The panel on the bottom shows the responding regions of the IPL color-coded according to their polarity (OFF, red; ON, green; ON-OFF, blue; see also Figure S3). Please note the calcium reporter expression in the IPL and in the RGC layer, plus some rare displaced retinal ganglion cells localized in the inner nuclear layer (INL). Note also the preferential distribution of OFF responses in the sublamina b of the IPL and of ON and ON-OFF responses in the sublamina a of the IPL (bottom). Scale bar represents 200 μm. (B) Average response of 186 OFF ROIs from RGC dendrites n = 5 eno2::GCaMP3.5 transgenic zebrafish to the same temporal contrast protocol in Figure 2, before (dark red) and after (light red) methionine administration. SEM is indicated in gray. Please note how methionine reduced the amplitude of OFF responses in a similar way to that observed for OFF bipolar cell terminals (Figure 2A). (C) Plot of contrast versus response amplitude averaged from the same population of OFF ROIs shown in (B). As for Figure 2, the response is measured as the steady deflection from the baseline. Dotted lines are fits of a power function, A = k × Cα, with α = 2.96 ± 0.11 in control and α = 3.27 ± 0.09 in methionine. (D and E) Average response to contrast and contrast versus response amplitude plot of 69 ON ROIs from RGC dendrites, to the same temporal contrast protocol in Figure 2, before (dark green) and after (light green) methionine administration. Dotted lines are fits of a power function, A = k × Cα, with α = 2.32 ± 0.12 in control and α = 2.11 ± 0.20 in methionine. (F and G) Average response to contrast and contrast versus response amplitude plot of 79 ON-OFF ROIs from RGC dendrites, to the same temporal contrast protocol in Figure 2, before (dark blue) and after (light blue) methionine administration. Dotted lines are fits of power functions, A = k × Cα, with α = 2.65 ± 0.25 in control and α = 3.18 ± 0.15 in methionine. Please note that methionine reduced the amplitude of ON-OFF responses in a similar way to that observed for OFF retinal ganglion cells (B and C) and OFF bipolar cell terminals (Figures 2A and 2B). See also Figure S3. |